Another ATR Trailing Stop

v10.3
Another ATR Trailing Stop

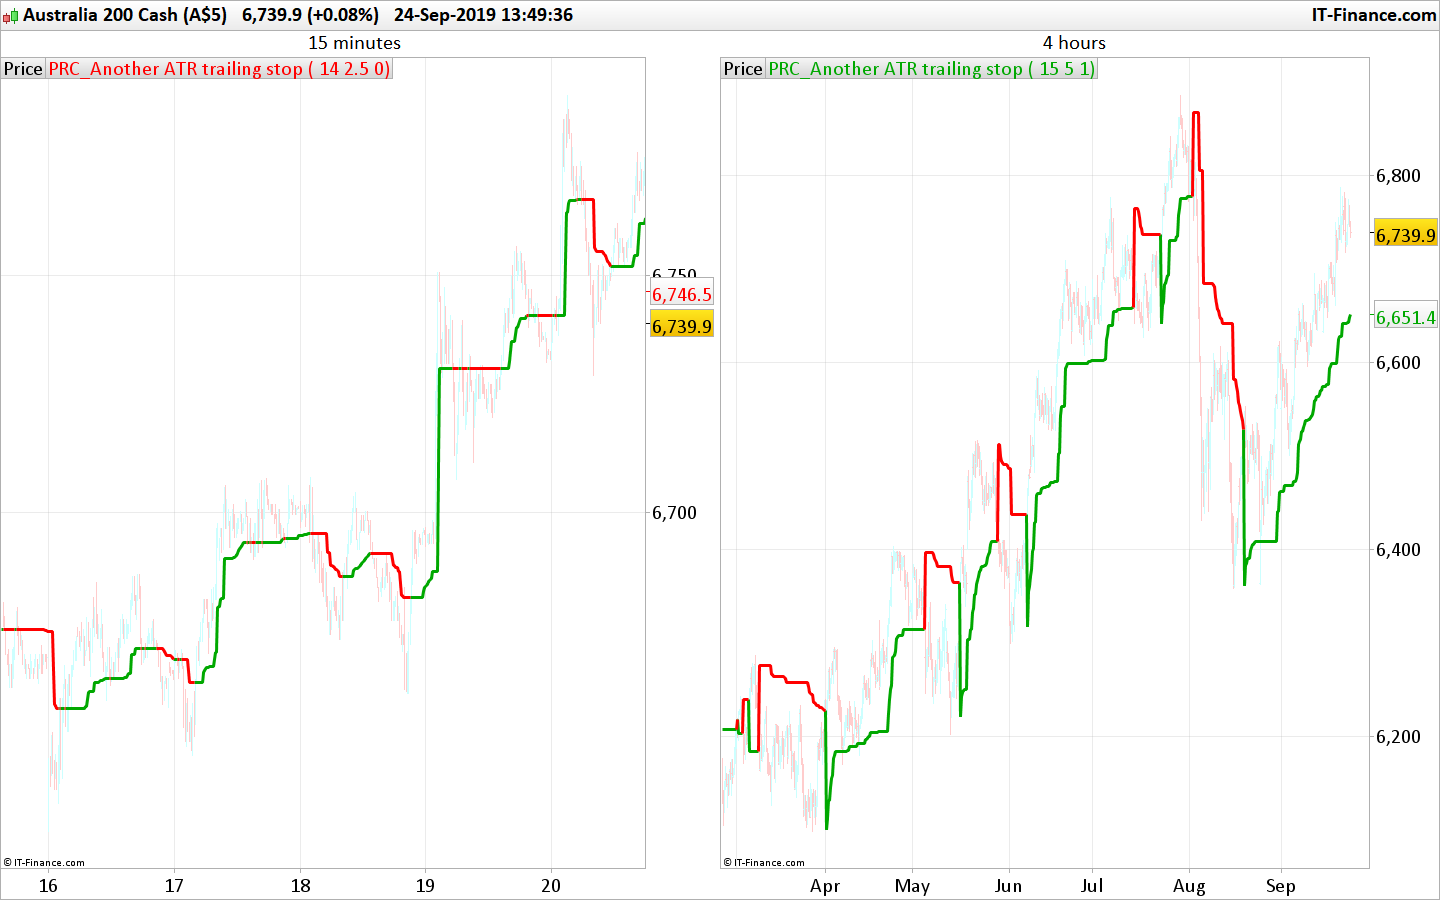
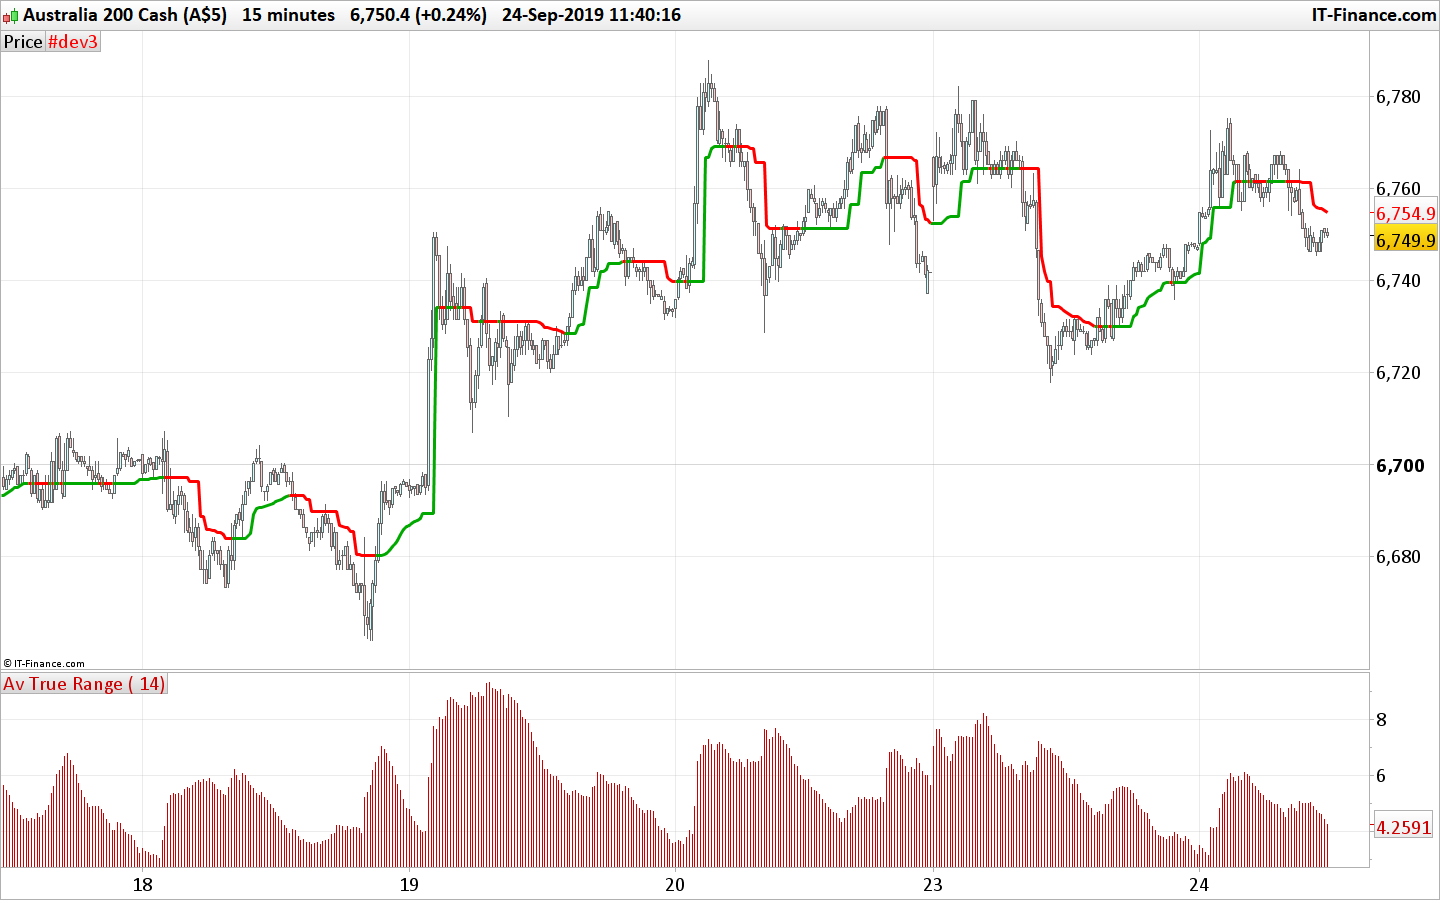
Closely following the price with the Another trailing stop ATR (Average True Range), a based trend following indicator. The idea of this indicator is to closely following the price to get out quickly if the price tends to not move enough to ensure the trend is profitable.

This version uses declining ATR to closely adapt its level to the price. The trailing stop line is following the highest Close (green when it is bullish) or Lowest Close (red when it is bearish) by adding or subtracting the ATR value multiplied with the “mult” setting.

If the ATR (aka price volatility) is ascending, then the trailing stop keep its previous level. When it is declining, the trailing stop level adapt its value according to the current trend:

  • Long trend: if the new calculated level is higher than the previous one
  • Short trend: if the new calculated level is lower than the previous one

The ATR trailing stop has 2 modes: (“mode” setting)

  • mode=0 ; the trend line will keep the same level each time a cross over occur
  • mode>0 ; the trend line will take the highest or lowest Close level each time a cross over occur

The chosen mode of the trailing stop line behavior depends of your own trading style, traded instrument and timeframe.

Idea come from this topic in the indicator’s forum: ATR TRAILING STOP

If you have other ideas, nevermind opening a new topic in the forum describing what you have in mind. The community will try to help you achieving your goal!


Share this

Risk disclosure:

No information on this site is investment advice or a solicitation to buy or sell any financial instrument. Past performance is not indicative of future results. Trading may expose you to risk of loss greater than your deposits and is only suitable for experienced investors who have sufficient financial means to bear such risk.

ProRealTime ITF files and other attachments : How to import ITF files into ProRealTime platform?

PRC is also on YouTube, subscribe to our channel for exclusive content and tutorials

  1. s00071609 • 09/24/2019 #

    I tried this indicator to trail stop. Problem i am facing is that, when there is a trend change, say from bullish to bearish. For example, In a short entry – I get stopped out when price moves back and touches the support line of Bullish Trend. While the purpose of stop is to sell when the BEARISH upper line is crossed (when short in market), positions get stopped out at start of the trend. I think this is unintended consequence. I tried similar another indicator, same thing happens. How would be possible to BUY only when RED line above is crossed in Short Entry and Bottom Green line when Long?

    • Nicolas • 09/24/2019 #

      Use the color variables R and G to test if the trend is bullish (R=0) or bearish (R>0).

  2. s00071609 • 09/24/2019 #

    Where can i find the syntax to test the colour of the line, I am calling the indicator values at the moment, this is my current code,

    ts= Call “ATR STOP2”
    IF SHORTONMARKET AND close > TS THEN
    BUY AT MARKET
    ENDIF

    I tried few syntax but it gives error. Could you please help?

    • Nicolas • 09/24/2019 #

      You should open a new topic to discuss about the strategy and its coding.

  3. dvlukic • 09/24/2019 #

    Hello Nicolas,
    How could plot this indicator over the price series?
    Thanks
    Dave

    • Nicolas • 09/24/2019 #

      Just add it on the price series.

  4. yomisadiku • 353 days ago #

    Hello Nicolas,
    Can I use high and low price at lines hh=max(hh,close) and ll=min(ll,close) instead of close ? What impact would that make to my tracking?

    Thank you.
    Ahmed

    • Nicolas • 353 days ago #

      Yes you can do that, the impact will be that the trailing stop line will be much close to the price.

avatar
Register or

Likes

avatar avatar avatar avatar avatar avatar avatar avatar avatar avatar avatar avatar avatar avatar
Related users ' posts
Thomas
5 years ago
Thomas Como? no intiendo. Can you write in english . It works! Download the itf file.
Thomas New Version comin soon...
CHARLESRACHELLE OLA NAO SERVE PARA MT4?
AlgoAlex
5 years ago
Marcot18 Alex ti sei superato
AlexF Esagerato!
nfulcher Please could someone explain how the following code is calculated:- iDI = TEMA[3](DI[DI2]...
oakenstream Jan, I find sometimes that the priceexit variable is never set. It seems to happen when the ...
Matt66612 I do not understand the first time I launch the backtest I got the same result as you. but ...
SL Hi, Fer666 Thank you for sharing. If I want to show daily ST on a 10_min intraday chart...
SL correction above... system had remove"not equal" signs Line 19 : change to if WeekNo "Not...
SL OK... I had figured out... need more than that. Thank you anyway.
coscar Ottimo lavoro. come sempre!
luxrun Nello studio di Sepiashvili viene descritto anche un altro indicatore, il Q-indicator, che è...
juanj
5 years ago
juanj I have actually completely redesigned this indicator with loads of improvements, so will res...
Maik2404 wie kann ich den Code bekommen Paul?
jens_kittner Works with US Crude at 1h as well!
Jean-Claude REGIS Je préconise de regarder les graphiques H1 et M15 pour visualiser la tendance de fond et d'...
capgros Bonjour @Nicolas, Thanks a lot for this tool, it is very useful for me. I would like to s...
Hans63 Would you add the possibility to color also the Heikin Ashi and bar chart?
Nicolas That's possible, please open a new topic in the indicator forum explaining what you need exa...
ottimo Thank you Nicolas, great indicator, N. 1
tikigai Merci Nicolas! First Happy new Year 2020. Very good indicator BUT (yes the french "oui, m...
Nicolas Whats prorealtime version? Did you try in version prior to v11? indicator's call and loop ca...
Nicolas
6 years ago
BSTrend
v10.3
BSTrend
10
Indicators
Florian Legeard C’est à dire sur le prix et non sur le temps ? Merci
Rohit82189 bstrend repaints
Nicolas No, it doesn't repaint.
Marcos Alvarez Dominguez Hello Nicolas, is it possible to stablish a bullish screener for this indicator when the cen...
Nicolas Please open a topic in the screener section to ask for this specific query.
zaher123 Hello, the indicator doesn't show up anything on the screen, any suggestions please?
Juan Salas Hi FULVIO09, Nice piece of work. It seems to work very well. Does only work for INDEXES??...
Johann Hi @FULVI09, I understand the instructions however I'm not too sure how to determine the "p...
Player8520 Hello, It doesn't work with me either. However, I changed AA to 180 on line 15, added th...
cfta Hi Fulvio, many thanks for sharing this clever indicator, much appreciated. As Pepsmile ment...
cfta Sorry adding the PRT to code didn't work in the above comment so I guess we will have to set...
juanj Something appears to be wrong with this formula as graphing t shows t to almost never be wit...
Nicolas Apply it on the price chart. The indicator plot just one single line. There are two in the...
jamesoc Hi Nicolas, do you happen to know if there is an indicator that can be applied to charts, to...
gustavobp Buenos dias Nicolas, al agregar tu indicador no me reconoce la variable Price ni en la linea...
Nicolas
6 years ago
Maxime Baudin Interesting, Thank you! :)
franck-david Bonjour Nicolas , actuellement je me forme grace a vos videos tres tres bien expliques mer...
Nicolas Merci. ça n'est pas le lieu pour poser ce genre de question :) Merci d'utiliser le forum Pro...
joobeng Sorry, I solved the problem. I have add the CBL indicator using the spanner icon on the pric...
Nicolas Adjust the price settings for the Y Axis to use the price only.
XXXXVII Hello Your indicator is interesting. However, I can't see the orange line. Do you have ...
bharatjai Script 'Adaptive ATR' has been saved line 24: no viable alternative at input 'lr' Gettin...
Nicolas download the itf file and import it into your platform.
Francis3332 Bonjour à tous, J'aime beaucoup cet indicateur et j'aimerais pouvoir l'utiliser sur la dern...

Top