

myCandle V1.4
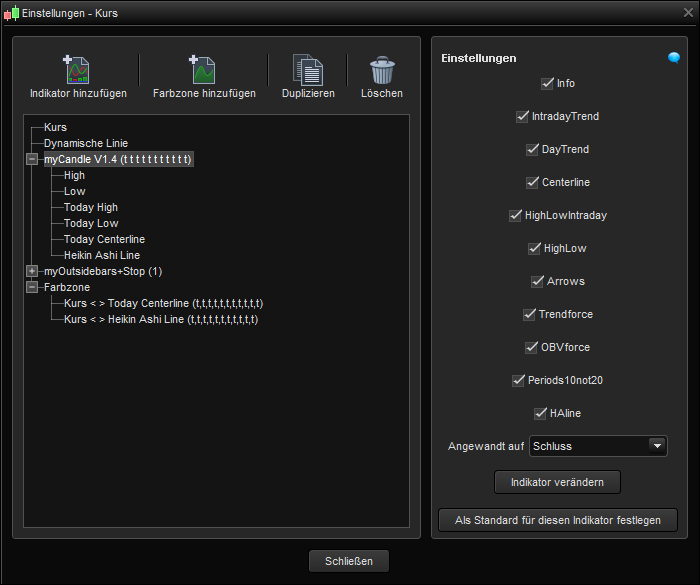
Info: Shows the range of previous candle, ATR 10 and EMA 20 of ATR10.
If ATR is greater than its average or Range greater then ATR the text will be displayed in orange =Better moves.
And the ranges between intraday daily hgh – low and the range of last five days as (<> 123/123).
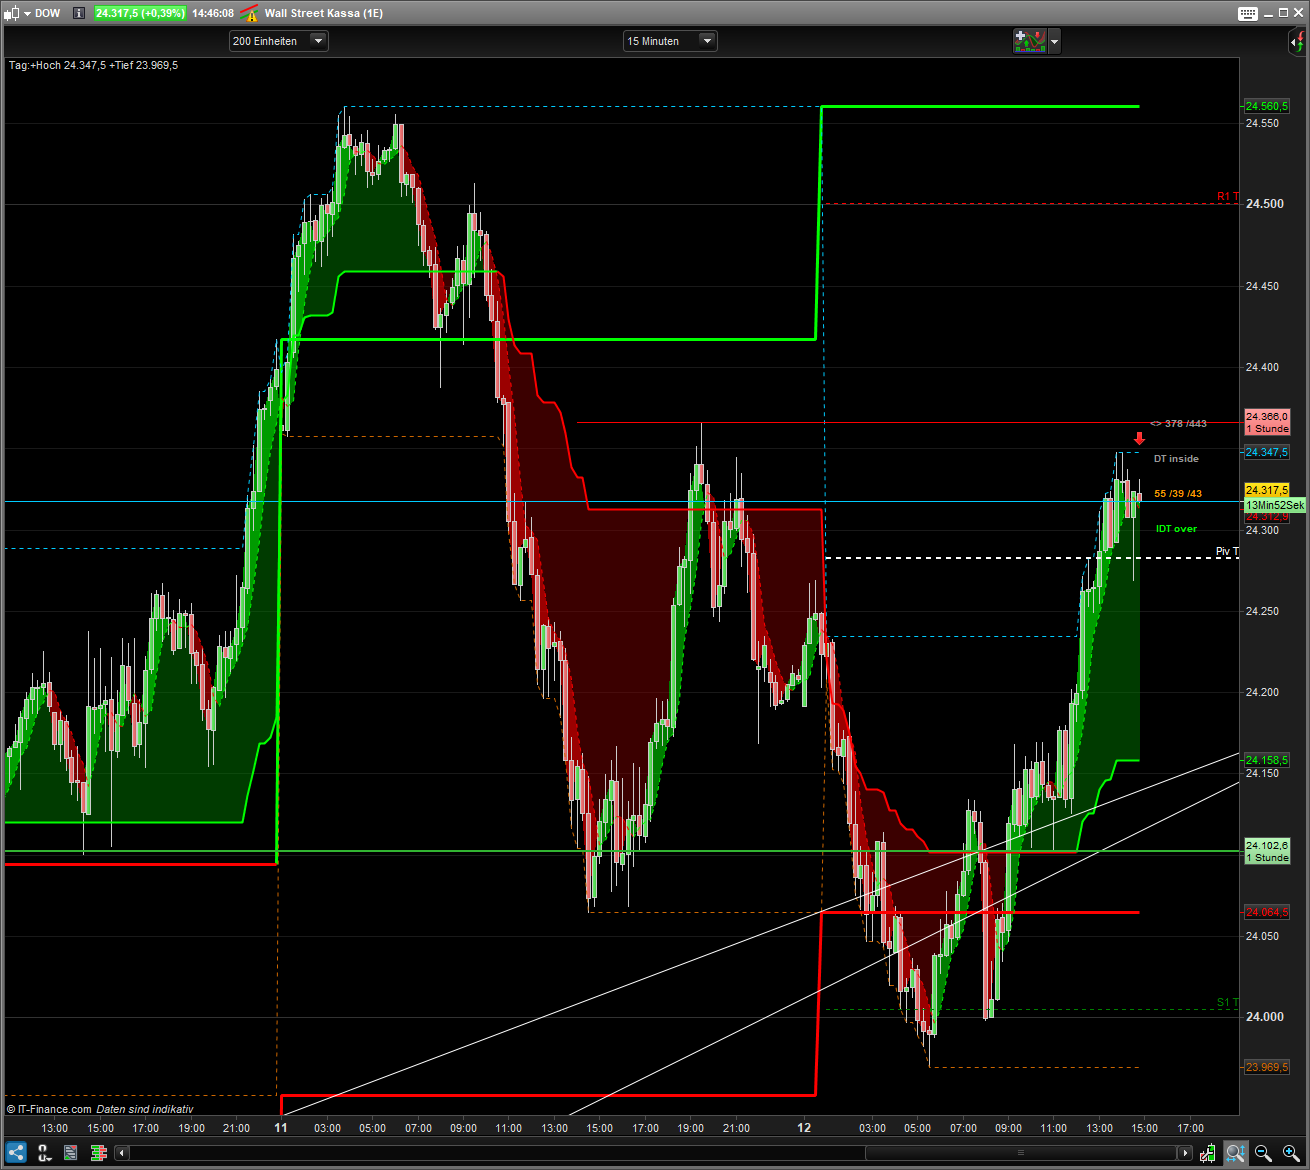
IntradayTrend: Close over Centerline (Intraday Range) displayed green Text “IDT over” and revers red Text “IDT under”. The idea is when the price is over the middle intraday range then we have at the moment intraday a Bulltrend and revers.
Daytrend: Close over yesterday high displayed green Text “DT over” and revers under yesterday low red Text “DT under”. The idea is when the price is over yesterday high then we have at the moment ia daily Bulltrend and revers under low.
Centerline: Show the middle of the range between Intraday high and low as a dotted line.
High/LowIntraday: Show the intraday highest high and lowest low as line. High as line like a resist and low like a support. Or revers.
HighLow: Show the daily highest high and lowest low beginning on yesterday.
Arrows: Shows Arrows in green and red color. When the Price Trend (calculation in code) over EMA20 and OBV (On Balance Volume) over EMA10 and EMA20 displayed green Arrow and revers. Depends on “Trendforce” and / or “OBVforce” activation checkbox.
Trendforce: Trend strength is used to calculate the arrows. For this, “Arrows” must be also activated. Or also with “OBVforce”.
OBVforce: Volumen strength, based on OBV, is used to calculate the arrows. For this, “Arrows” must be also activated. Or also with “Trendforce”.
Example. You can deactivate for instrument whitout OBV/Volume Data. Forex, etc.
Periods10not20: Activated the calculation for Trendforce and OBVforce based on 10 period. Not actived 20 periods.
You can / should define the color zone yourself. One for course over / under Heikin Ashi Line and one for course over / under Centerline.
Of course you can show and hide everything as you like.
Update from https://www.prorealcode.com/prorealtime-indicators/mycandle-infos-v1-2/
I trade this in combination with Kombination mit myOutsidebar+Stop, myOpening Range…, MyThermometer
// myCandel-Infos-V1.3
// 18.06.2019 (Release 1.2)
// 18.04.2020 (Release 1.3)
// 01.05.2020(Release 1.4)
// Thomas Geisler
// Sharing ProRealTime knowledge
// https://www.prorealcode.com/library/

defparam drawonlastbaronly=true // Zeichung nur am letzten Bar

//--init--
alpha = 255
TP = myEATR/2  //Position for Infos
lookback = 1
// Info = 1
// IntradayTrend
// DayTrend = 1
// Centerline = 1
// HighLowIntraday = 1
// HighLow = 1
// Arrows = 1
// Trendforce = 1
// OBVforce = 1
//-- end--

//--Info--
// previous Candle Range[1] and ATR[10] and EMA-ATR[20]of ATR[1]
myRange = round(Range[1])
myATR = round(AverageTrueRange[10](close[0]))
myEATR = round(ExponentialAverage[20](AverageTrueRange[10](close[0])))

// Forex without round
//myRange = Range[1]
//myATR = AverageTrueRange[10](close[0])
//myEATR = ExponentialAverage[20](AverageTrueRange[10](close[0]))

//--centerline (DM0) and intraday range (DMR)
mytdayhigh=DHigh(0)
mytdaylow=DLow(0)
DM0 = (mytdayhigh-mytdaylow)/2+mytdaylow
DMR = round((mytdayhigh-mytdaylow))

//--rounded range of last five days
D1 = DHigh(1)-DLow(1)
D2 = DHigh(2)-DLow(2)
D3= DHigh(3)-DLow(3)
D4 = DHigh(4)-DLow(4)
D5 = DHigh(5)-DLow(5)
DMA = round((D1+D2+D3+D4+D5)/5)
//--end--


//--Dailys highest high and lowest Low--
if day <> day[1] then
dayindex = dayindex + 1
dayhigh = 0
daylow = close
//dayopen = open
//dayclose = close

if dayindex > lookback then
for j = 1 to barindex
if dayindex[j] = dayindex - lookback then
mydayhigh = dayhigh[j]
mydaylow = daylow[j]
break
endif
next
endif
endif

dayhigh = max(dayhigh,high)
daylow = min(daylow,low)
//--end--


//--show or not, Daily High / Low Line
if HighLow = 1then
mydayhigh2 = mydayhigh
mydaylow2 = mydaylow
endif
// change color od Day Hig/Low Lines
If mydayhigh[0] > mydayhigh[1] and mydaylow[0] > mydaylow[1] then
dha = 0
dhb = 255
dla = 255
dlb = 0
elsif mydayhigh[0] < mydayhigh[1] and mydaylow[0] < mydaylow[1] then
dha = 255
dhb = 0
dla = 0
dlb = 255
elsif mydayhigh[0] > mydayhigh[1] and mydaylow[0] < mydaylow[1] or mydayhigh[0] < mydayhigh[1] and mydaylow[0] > mydaylow[1]then
dha = 255
dhb = 153
dla = 255
dlb = 153
endif
//--end--


//--show or not, centerline, center of range between intraday high/low--
If CenterLine = 1 then
mytdaycenter = DM0
else
mytdaycenter = undefined
endif

if mytdaycenter[0] > mytdaycenter[1] then
cla = 0
clb = 255
elsif mytdaycenter[0] < mytdaycenter[1] then
cla = 255
clb = 0
endif
//--end--


// Ranges Candels in different colour and print today daily range (High/Low)
If Info = 1 then
DrawText("                           <> #DMR#/#DMA#",barindex,open+TP+TP,Dialog,Bold,10) coloured(153,153,153,alpha)
if myATR > ExponentialAverage[20](myATR)  or myRange > myATR then
DrawText("                           #myRange#/#myATR#/#myEATR#",barindex,open,Dialog,Bold,10) coloured(255,153,0,alpha)
else
DrawText("                           #myRange#/#myATR#/#myEATR#",barindex,open,Dialog,Bold,10) coloured(153,153,153,alpha)
endif
endif
//--end--

//-- proof close over/under Centerline and/or close over/under yesterday high/low--
If DayTrend = 1 then
if close < mydayhigh[1] and close > mydaylow[1] then
DrawText("                         DT inside",barindex,open+TP,Dialog,Bold,10) coloured(153,153,153,alpha)
elsif close > mydayhigh[1] then
DrawText("                         DT over",barindex,open+TP,Dialog,Bold,10) coloured(0,255,0,alpha)
elsif close < mydaylow[1] then
DrawText("                         DT under",barindex,open+TP,Dialog,Bold,10) coloured(255,0,0,alpha)
endif
endif

If IntradayTrend = 1 then
if close > DM0 then
DrawText("                         IDT over",barindex,open-TP,Dialog,Bold,10) coloured(0,255,0,alpha)
else
DrawText("                         IDT under",barindex,open-TP,Dialog,Bold,10) coloured(255,0,0,alpha)
endif
endif
//--end--

//--Show Intraday HighLow as dotted line--
If HighLowIntraday = 1 then
mytdayhigh = DHigh(0)
mytdaylow = DLow(0)
else
mytdayhigh = undefined
mytdaylow = undefined
endif
//--end--

//--Arrows--
//Trend bzw Trend force
if Arrows = 1 then
if Periods10not20 = 1 then //Periods 10
BullTrend = (Close - LOWEST[10](LOW)) / AVERAGETRUERANGE[10]
BearTrend = (HIGHEST[10](HIGH) - Close) / AVERAGETRUERANGE[10]
Trend = (BullTrend - BearTrend)
TrendEMA = ExponentialAverage[10](Trend)
// On Balance Volumen zur Bestimmung der Kaufkraft der Bewegung/Trend
myOBV = OBV
myOBVA1 = ExponentialAverage[10](myOBV)
else //Periods 20
BullTrend = (Close - LOWEST[20](LOW)) / AVERAGETRUERANGE[20]
BearTrend = (HIGHEST[20](HIGH) - Close) / AVERAGETRUERANGE[20]
Trend = (BullTrend - BearTrend)
TrendEMA = ExponentialAverage[20](Trend)
// On Balance Volumen zur Bestimmung der Kaufkraft der Bewegung/Trend
myOBV = OBV
myOBVA1 = ExponentialAverage[20](myOBV)
endif
if Trendforce = 1 and OBVforce = 1 then
If Trend > TrendEMA and myOBV > myOBVA1 then //and myOBV > myOBVA2 then
DRAWARROWup(barindex,low-TP) coloured(0,255,0,alpha)
elsif Trend < TrendEMA and myOBV < myOBVA1 then //and myOBV < myOBVA2 then
DRAWARROWdown(barindex,high+TP)coloured(255,0,0,alpha)
endif
elsIf OBVforce = 1 and not Trendforce then
if myOBV > myOBVA1 then //and myOBV > myOBVA2 then
DRAWARROWup(barindex,low-TP) coloured(0,255,0,alpha)
elsif myOBV < myOBVA1 then //and myOBV < myOBVA2 then
DRAWARROWdown(barindex,high+TP)coloured(255,0,0,alpha)
endif
elsIf Trendforce = 1 and not OBVforce then
if Trend > TrendEMA then
DRAWARROWup(barindex,low-TP) coloured(0,255,0,alpha)
elsif Trend < TrendEMA then
DRAWARROWdown(barindex,high+TP)coloured(255,0,0,alpha)
endif
endif
endif
//--end--

// Show or not Heikin Ashi Line
if HAline = 1 then
once haOpen = open
once haClose = Close
N = 0

if barindex = 0 then
haOpen = open
haClose = close
elsif N = 0 then
haClose =(Open+High+Low+Close)/4
haOpen =(haOpen[1]+haClose[1])/2
endif

if haOpen[0] > haOpen[1] then
haa = 0
hab = 255
else
haa = 255
hab = 0
endif
endif
//--end--

// To show Outsidebar use external Indicator OutsideBarColorSolo.itf

Return mydayhigh2 COLOURED (dha,dhb,0)style(line,3) AS "High", mydaylow2 COLOURED (dla,dlb,0)style(line,3) AS "Low", mytdayhigh COLOURED (0,204,255)style(dottedline,1) AS "Today High", mytdaylow COLOURED (204,102,0)style(dottedline, 1) AS "Today Low", mytdaycenter COLOURED (cla,clb,0 )style(line,2) as "Today Centerline", haOpen COLOURED (haa,hab,0 )style(dottedline,1)as "Heikin Ashi Line"

// End and make money