







Trend Histogram CCI
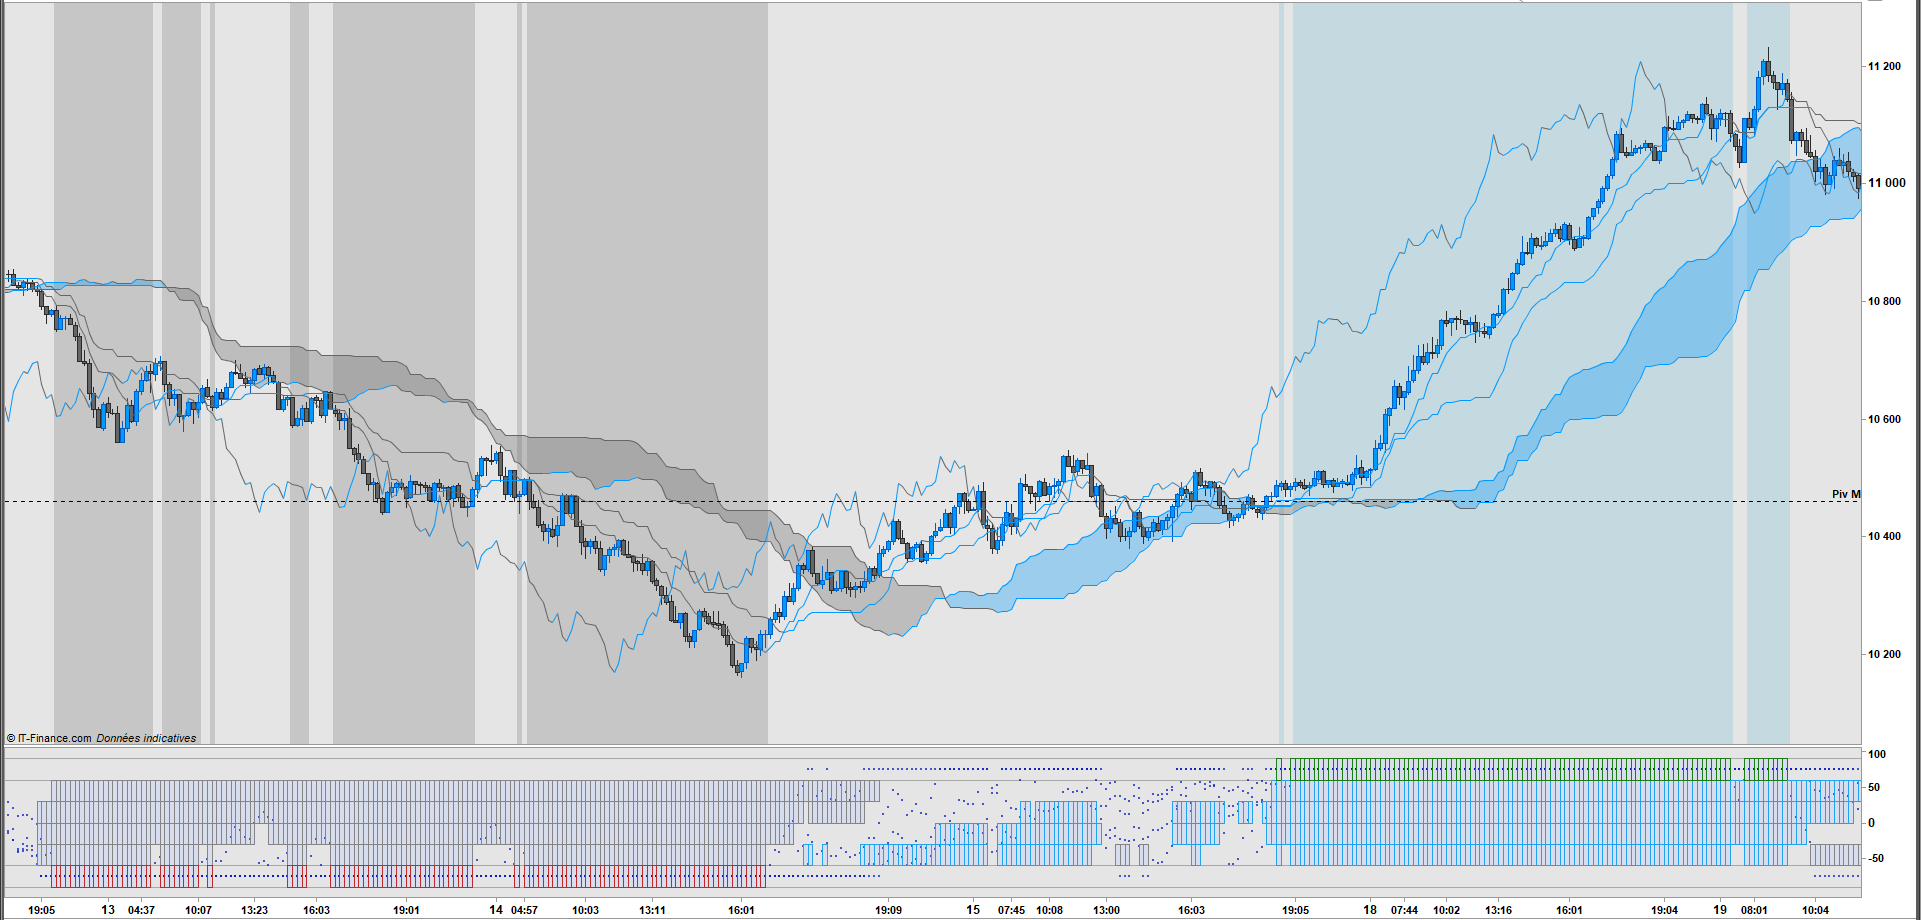
The purpose of Trend Histogram is to detect a trend at the most opportune moment
Operation
Trend Histogram uses the functions of the CCI (Commodity Chanel Index) to calculate whether the price is in a trend phase.
For this, the CCI is used under four basic values which allows it to have a short, medium and long view of the market situation.
How to use it
Trend Histogram ((Indicator))
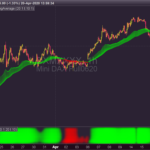
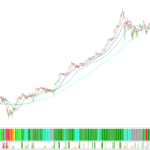
Its fundamental goal is to indicate you visually if there is a trend or not in the form of a red or green rectangle, you can also see the movements of the CCI in the indicator (in the form of dots and rectangle) to give you a overview of its current level.
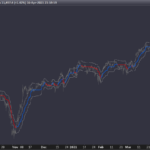
A BackGroundColor is provided to visualize the indicator on the Main Graph
It is obviously recommended to position yourself in a market that converges with these higher timeframes.
So, use this indicator on a multi timeframe.
Once the timeframe has converged, you can apply an intervention strategy
//--------------------Paramettre de Base

//Paramettre de Cadrage
if close > open then
signalC = 1
else
signalC = 0
endif
if signalC = 1 then
drawcandle(95,95,95,95)coloured(0,0,0,0)
endif
if signalC = 0 then
drawcandle(-95,-95,-95,-95)coloured(0,0,0,0)
endif

//--------------------Visuel CCI

//CCI50
CCI50 = CCI[50]
if CCI50 > 60 then
CCI50 = 75
elsif CCI50 < -60 then
CCI50 = -75
endif

//CCI100
CCI100 = CCI[100]
if CCI100 > 60 then
CCI100 = 75
elsif CCI100 < -60 then
CCI100 = -75
endif

//CCI150
CCI150 = CCI[150]
if CCI150 > 60 then
CCI150 = 75
elsif CCI150 < -60 then
CCI150 = -75
endif

//CCI200
CCI200 = CCI[200]
if CCI200 > 60 then
CCI200 = 75
elsif CCI200 < -60 then
CCI200 = -75
endif

//--------------------Commandes Des Signaux Haussier

//Indicateur CCI
ID1 = CCI[50] => 60
ID2 = CCI[100] => 60
ID3 = CCI[150] => 60
ID4 = CCI[200] => 60

//Signal UP 50
if ID1 then
signal1 = 1
else
Signal1 = 0
endif
if signal1 = 1 then
drawrectangle(barindex[1],-60,barindex,-30)coloured(32,162,236)
endif

//Signal UP 100
if ID2 then
signal2 = 1
else
Signal2 = 0
endif
if signal2 = 1 then
drawrectangle(barindex[1],-30,barindex,0)coloured(32,162,236)
endif

//Signal UP 150
if ID3 then
signal3 = 1
else
Signal3 = 0
endif
if signal3 = 1 then
drawrectangle(barindex[1],0,barindex,30)coloured(32,162,236)
endif

//Signal UP 200
if ID4 then
signal4 = 1
else
Signal4 = 0
endif
if signal4 = 1 then
drawrectangle(barindex[1],30,barindex,60)coloured(32,162,236)
endif

//Signal Trend
if ID1 and ID2 and ID3 and ID4 then
signal5 = 1
else
signal5 = 0
endif
if signal5 = 1 then
drawrectangle(barindex[1],60,barindex,90)coloured(27,124,22)
endif

//--------------------Commandes Des Signaux Baissier

//Indicateur CCI
ID6 = CCI[50] =< -60
ID7 = CCI[100] =< -60
ID8 = CCI[150] =< -60
ID9 = CCI[200] =< -60

//Signal UP 50
if ID6 then
signal6 = 1
else
Signal6 = 0
endif
if signal6 = 1 then
drawrectangle(barindex[1],-60,barindex,-30)coloured(132,132,132)
endif

//Signal UP 100
if ID7 then
signal7 = 1
else
Signal7 = 0
endif
if signal7 = 1 then
drawrectangle(barindex[1],-30,barindex,0)coloured(132,132,132)
endif

//Signal UP 150
if ID8 then
signal8 = 1
else
Signal8 = 0
endif
if signal8 = 1 then
drawrectangle(barindex[1],0,barindex,30)coloured(132,132,132)
endif

//Signal UP 200
if ID9 then
signal9 = 1
else
Signal9 = 0
endif
if signal9 = 1 then
drawrectangle(barindex[1],30,barindex,60)coloured(132,132,132)
endif

//Signal Trend
if ID6 and ID7 and ID8 and ID9 then
signal10 = 1
else
signal10 = 0
endif
if signal10 = 1 then
drawrectangle(barindex[1],-60,barindex,-90)coloured(191,42,42)
endif

return -60coloured(73,73,73,100),-90coloured(73,73,73,100),60coloured(73,73,73,100),90coloured(73,73,73,100),CCI50 coloured(4,24,191,180) style (point,2),CCI100 coloured(4,24,191,180) style(point,2),CCI150 coloured(4,24,191,180) style(point,2),CCI200 coloured(4,24,191,180) style(point,2)
//Indicateur CCI
ID2 = CCI[50] => 60
ID3 = CCI[100] => 60
ID4 = CCI[150] => 60
ID5 = CCI[200] => 60
ID7 = CCI[50] =< -60
ID8 = CCI[100] =< -60
ID9 = CCI[150] =< -60
ID10 = CCI[200] =< -60


//Regroupement des commande
IDL = ID2 and ID3 and ID4 and ID5
IDS = ID7 and ID8 and ID9 and ID10


//Commande CCI
If IDL then
Signal = 1
elsif IDS then
Signal = -1
else
Signal = 0
endif

//Commande ADX
if ActiveADX then
ADXvalue = 0
else
ADXvalue = 1
endif

//Affichage
if signal = 1 and ADX > 22 then
backgroundcolor(62,169,203,50)
endif
if signal = 1 and ADXvalue = 1 then
backgroundcolor(62,169,203,50)
endif
if signal = -1 and ADX > 22 then
backgroundcolor(73,73,73,50)
endif
if signal = -1 and ADXvalue = 1 then
backgroundcolor(73,73,73,50)
endif

return
Comments
You must be logged in to post a comment.

Is it possible to put the itf-file in the right way here in Prorealcode? so the right 'trend-background-2.itf' and the right 'trend-histogramme.itf'? I tried to place the code in the file but did not work, i am not a programmer.
I gave the above message fix ;)
I can't import this indictor properly, it gives the warning "de volgende variabele is niet goed geactiveerd, active ADX'. Please solve this issue so i can use this indicator.

Bonjour, j'essaye de me faire un screener ichimoku à l'aide te ton code background. Pour l'instant il est comme ceci: //============================== Indicator SpanA = (Tenkan[26]+Kijun[26])/2 Tenkan = (highest[9](high)+lowest[9](low))/2 Kijun = (highest[26](high)+lowest[26](low))/2 SpanB = (highest[52](high[26])+lowest[52](low[26]))/2 //============================== Trend Bullish H1 = close > Tenkan[26] and close > Kijun[26] H2 = close > SpanA[26] and close > SpanB[26] H3 = close > open[26] and close > close[26] H4 = close > SpanA and close > SPanB TrendHaussier = H1 and H2 and H3 and H4 Screener [TrendHaussier] Le problème c'est que le screener me sort toute les actions qui sont en trend haussier or moi j'aimerais que le screener m'affiche seulement les actions qui viennent juste de commencer le trend (que la dernière bougie sois la première qui fasse apparaitre le background) Sais tu ce que je devrais écrire dans le code ? Merci d'avance :)

Fixed ITF Trend Background //Indicateur CCI ID2 = CCI[50] => 60 ID3 = CCI[100] => 60 ID4 = CCI[150] => 60 ID5 = CCI[200] => 60 ID7 = CCI[50] =< -60 ID8 = CCI[100] =< -60 ID9 = CCI[150] =< -60 ID10 = CCI[200] =< -60 //Regroupement des commande IDL = ID2 and ID3 and ID4 and ID5 IDS = ID7 and ID8 and ID9 and ID10 //Commande CCI If IDL then Signal = 1 elsif IDS then Signal = -1 else Signal = 0 endif //Affichage if signal = 1 then backgroundcolor(62,169,203,50) endif if signal = -1 then backgroundcolor(73,73,73,50) endif return
Update link ;) https://www.prorealcode.com/topic/trend-histogramme-cci-mise-a-jour-suite-a-demande/