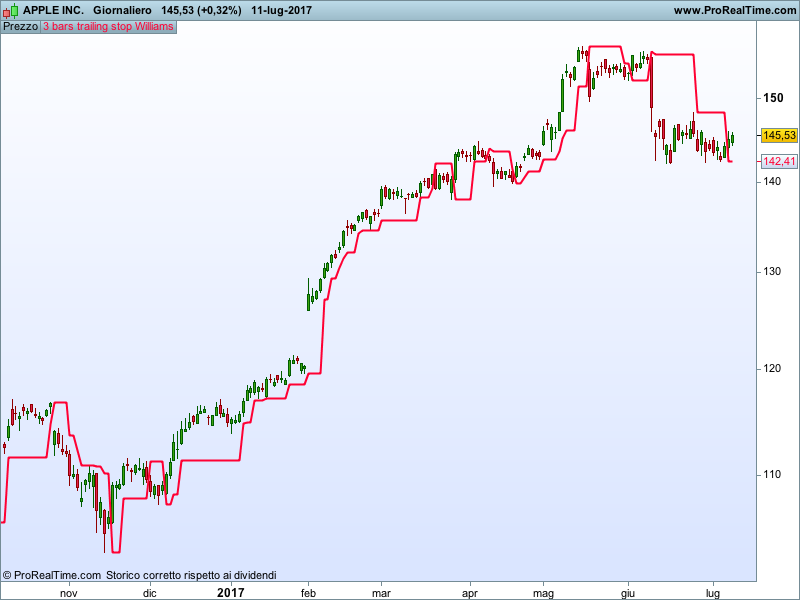
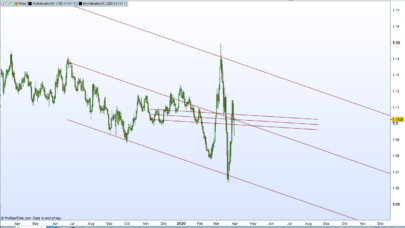
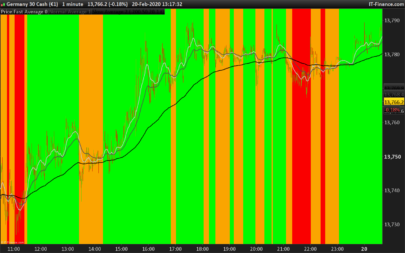
This is one of the very best trading techniques I have ever developed. The reason why is that it often rides mega trend markets for a long , long time, yet does not give back much profit when the correction begins as conventional moving average and channel.
This technique can be used not only as an exit techniques, but as an entry technique as well. It is really quite simple. Once the market is in a run away move, as I call it a “rock and roll” market – then and only then – do we use this exit. Price must be out of a trading range.
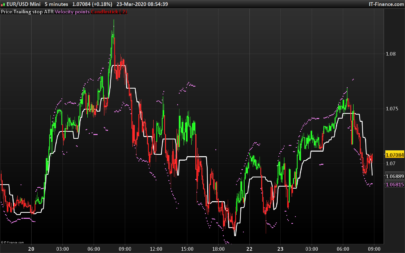
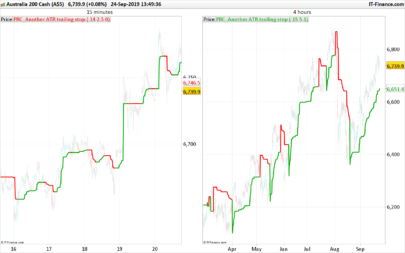
As a trailing stop: Make certain prices are out of congestion, they have begun to run, then, and only then, implement this as your trailing stop (i.e. exit).
For entry: Make certain the market is really set up. Sometimes the first entry will be false as a straight up or down market usually “bases” before the next trend move begins.
(excerpt from the author’s description of this trend following indicator)
This indicator has been requested by Maximus 78 here (https://www.prorealcode.com/topic/3-bar-trailing-stop-di-larry-williams/).
Blue skies!!!
|
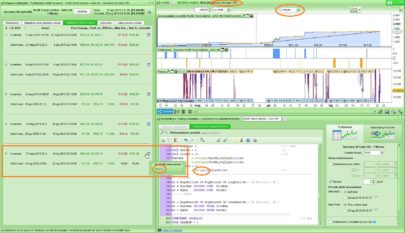
1 2 3 4 5 6 7 8 9 10 11 12 13 14 15 16 17 18 19 20 21 22 23 24 25 26 |
count=1 i=0 j=i+1 tot=0 while count<4 do tot=tot+1 if (low[j]>=low[i]) and (high[j]<=high[i]) then //inside bar j=j+1 else count=count+1 i=i+1 J=i+1 endif wend basso=lowest[tot](low) alto=highest[tot](high) if close>alto[1] then ref=basso endif if close<basso[1] then ref=alto endif return ref |
Share this
No information on this site is investment advice or a solicitation to buy or sell any financial instrument. Past performance is not indicative of future results. Trading may expose you to risk of loss greater than your deposits and is only suitable for experienced investors who have sufficient financial means to bear such risk.
ProRealTime ITF files and other attachments :
Find other exclusive trading pro-tools on ![]()
PRC is also on YouTube, subscribe to our channel for exclusive content and tutorials


Hi gabri,
great work! I am currently working on this 3 bar trailing stop for trading view and I have coded pretty much the same indicator as you.
But, the original requirement is to start counting at the highest close in an up move (and lowest close in a down move). So in particular once this highest/lowest close is found then apply then find the lowest/highest low of the last three bars which are not an inside bar.
The result would be an indicator the keep a bigger distance from the price action when the price moves sideways and does not make new highst/lowest closes.
So far my thoughts are that it is crucial to define first: “When did the up/down move begin!” This could be done by the indicator which you have already programmed. And then take this as a starting point to find the highst/lowest closes to calculate the further progression of the stop.
I haven’t found a way to do so. Would be great I you could think about this an share your ideas!
Thank you in advance!
Franz,
I see what you mean. I will try to work some code for that but I cannot make any promise.
G
Franz,
can this code work for you?
count=1
i=0
j=i+1
tot=0
//calcolo 3 barre
while count<4 do
tot=tot+1
if (low[j]<low[i]) and (high[j]>high[i]) then
//inside bar
i=i+1
j=j+1
else
count=count+1
i=i+1
J=i+1
endif
wend
if close>close[1] then
basso=lowest[tot](close)
endif
if close<close[1] then
alto=highest[tot](close)
endif
if barindex>1 then
if close > ref[1] then
ref=basso
endif
if close < ref[1] then
ref=alto
endif
endif
return ref
I also changed something between lines 5 and 14 to calculate the inside bars. I considered up trend any close above “ref” and downtrend any close below “ref”. Let me know if it works better.
G
Hi, can you show at least one strategy that works well with this indicator?
The idea is nice.
Thank you
Francesco,
I just tried to code an idea from Maximus 78 (https://www.prorealcode.com/topic/3-bar-trailing-stop-di-larry-williams/). I am sure he has all the info about strategies connected with this indicator. If I had to guess though I’d say that, being this a trailing stop indicator, it has to be used in conjunction with some other sort of trend indicator.
G
Good work ! I was looking for way to maximise profits and this serves it’s purpose well !
Thanks!!
Hi Gabri
I launched a very simple strategy based on the 3 bars trailing stop that you created and plugged it with a dynamic trailing stop from Nicolas;
it kikcked me out immediately but I don’t understand why;
Can you see the reason?
What should have been the code?
Very best,
Chris
PS : the insert code is not working here;
//————————————————————————-
// Code principal : STOP LOSS MM
//————————————————————————-
defparam preloadbars = 150
defparam cumulateorders = false
entry = 32.30
// trailing stop
count=1
i=0
j=i+1
tot=0
while count=low[i]) and (high[j]alto[1] then
TrailATR=basso
endif
if close entry
if condition then
buy n shares at market
//first stoploss:
SL = TrailATR
set stop ploss SL
dynamicSL = SL
endif
//dynamicSL
if longonmarket then
if(TrailATR>dynamicSL) then
dynamicSL=TrailATR
endif
sell at dynamicSL stop
endif
Hi. Has anyone coded a version that you could alter it to say 5 bar trailing stop? ie make the number of trailing bars a variable?
Please open a new topic in forums so we can code it there, thanks.