RSI MultiPeriods HeatMap

v10.3
RSI MultiPeriods HeatMap

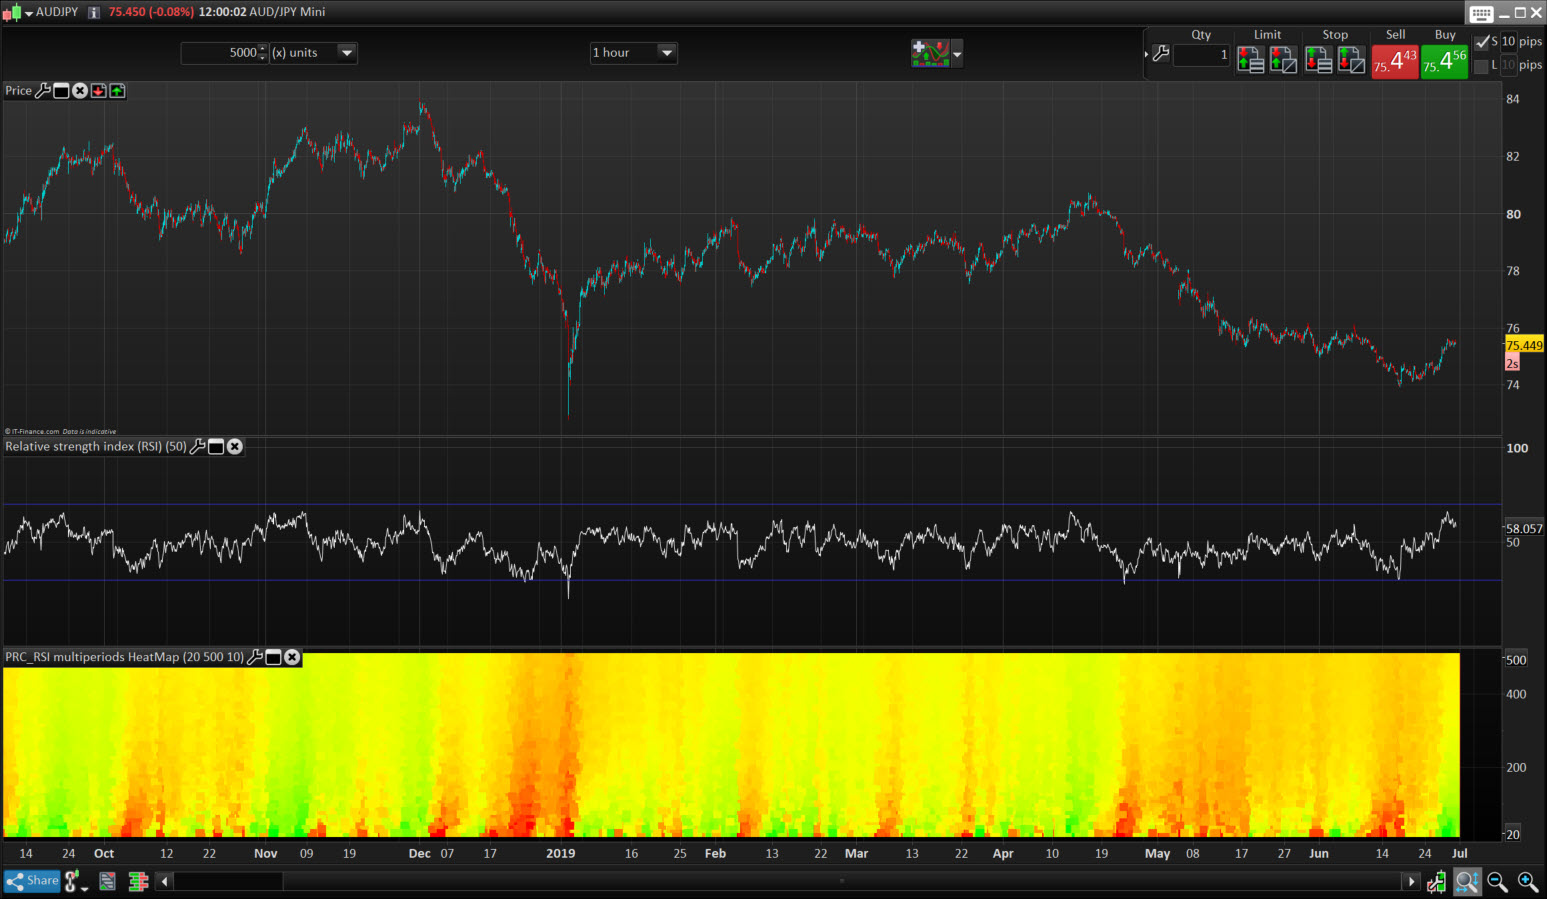
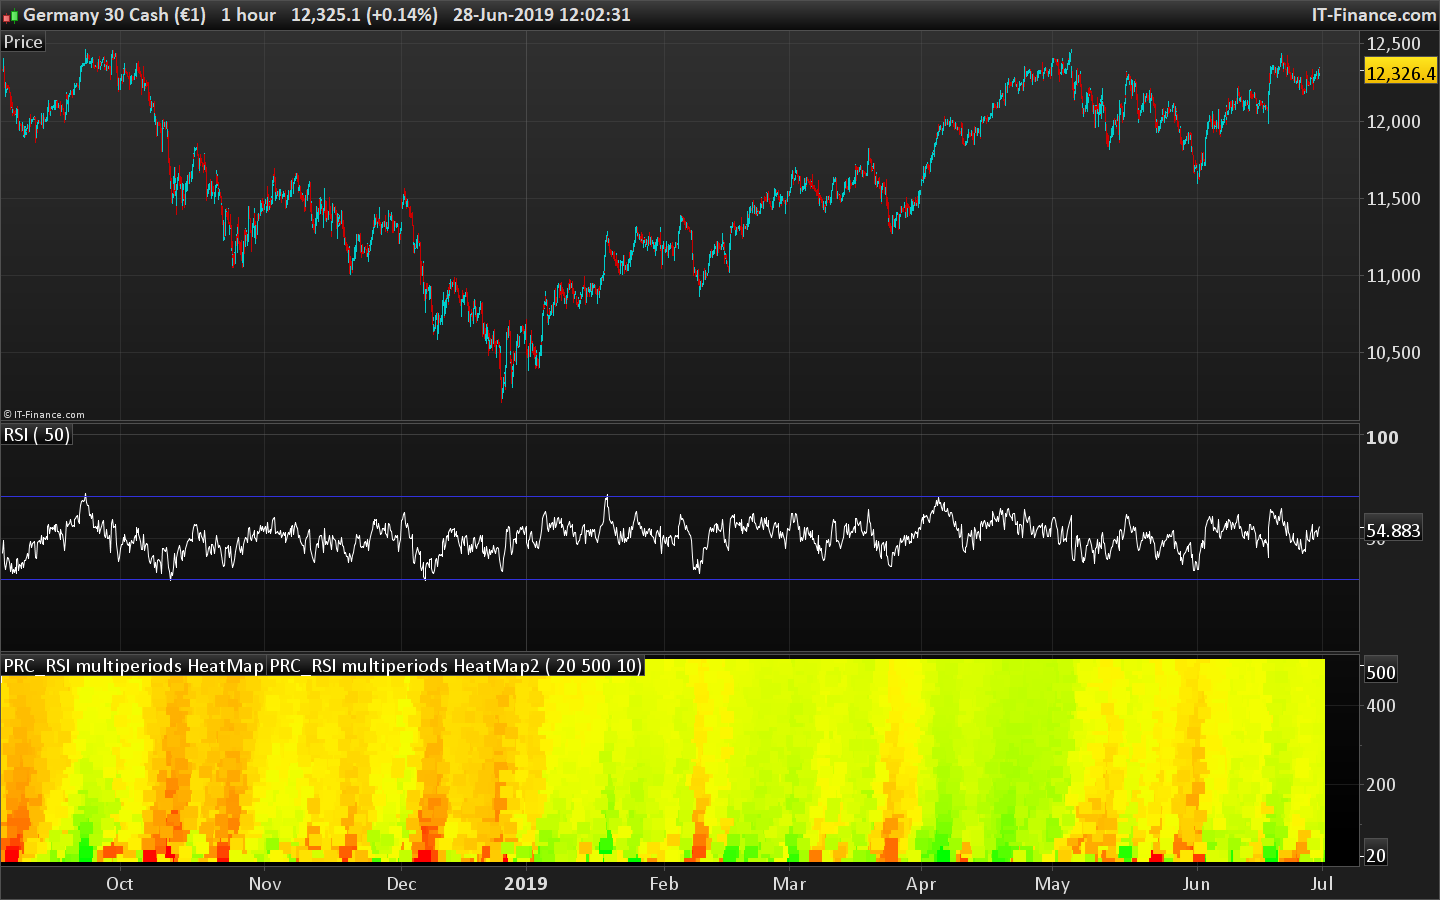
This “heatmap” type indicator plots the returned values of the RSI oscillator for all its calculated periods between the values of “StartPeriod” up to “MaxScale”. Each value is colored according to its degree of over-sold (in red) and over-bought (in green).

The ensemble thus forms a cloud of colored dots making it easy to better identify how the market behaves in the different dimensions.

It is thus possible to determine the best opportunities for positions in trend following or mean reversion without wondering what is the best period of observation with respect to the  instrument and the timeframe used. .

Many ideas can sprout from the observation of this type of indicator, I let you work 🙂

Idea came from another indicator development from that topic.


Share this

Risk disclosure:

No information on this site is investment advice or a solicitation to buy or sell any financial instrument. Past performance is not indicative of future results. Trading may expose you to risk of loss greater than your deposits and is only suitable for experienced investors who have sufficient financial means to bear such risk.

ProRealTime ITF files and other attachments : How to import ITF files into ProRealTime platform?

PRC is also on YouTube, subscribe to our channel for exclusive content and tutorials

  1. Maxime Baudin • 06/28/2019 #

    Very intresting! Thanks Nicolas

  2. Fr7 • 06/28/2019 #

    Es muy interesante….¿Podría realizar el screener que detecte los valores cuando en el heatmap está rojo o verde?

    • Nicolas • 06/28/2019 #

      Sí, pero podríamos estar limitados a los períodos debido a las limitaciones de 255 barras de ProScreener, pero ¿por qué no?

  3. Fr7 • 06/28/2019 #

    Podríamos probar el proscreener y así ayudaría a encontrar los valores que acaban de dar señal¿Cómo sería el screener Nicolas?

    • Nicolas • 06/28/2019 #

      Por favor, abra un tema en el foro para esta aplicación de filtro.

  4. ggolfet • 06/28/2019 #

    I tried to use it (with prorealtime version 11 – end of day version). I receive an error message regardind an infinite loop or too much iteractions. I tried decreasing the end period of the loop, but the error message still remains. I’m not able to find a solution, has anyone the same problem? thanks in advance

    • Nicolas • 06/28/2019 #

      Try to reduce the displayed units of the chart.
      MaxScale should always be superior to StartPeriod.

  5. ggolfet • 06/28/2019 #

    Thanks Nicolas, I imported the itf file and solved the problem.

  6. Hasardeur • 06/28/2019 #

    Hallo Nicolas,

    i tried to code the multi period heat map in combination with the Ehler’s market mode.
    https://www.prorealcode.com/prorealtime-indicators/market-mode/
    The code it self is easy to realize, but I see different results by
    – Calculation the market mode by using a single period for example 20
    – Calculation the heat map by using while loop
    Same I see by calculation other indicators.
    All are using band pass filter with look back days.
    I expect that the look back days [1] [2] [3] in combination with the while loop are causing the problem.
    It would be very helpful, if you could have a look for these problem.
    Many thanks in advance.

    Best regards
    Hasardeur

    • Nicolas • 06/28/2019 #

      Please open a new topic with the code in forum.

avatar
Register or

Likes

avatar avatar avatar avatar avatar avatar avatar avatar avatar avatar
Related users ' posts
MaoRai54 Thanks, now it's OK. in your first code at line 15-16 it's missing.
Madrosat Hello Ivan Did you try a strategy with this indicator
Iván Hi. No I didn't. This is a code translation requested by an user a few days ago.
Bateson
4 months ago
Matriciel Very nice job ! Is it possible to do the opposite because what interests me is to have the ...
YvesRobert Hi Matriciel, how can we do this, because stochastic is limited between 0 and 100 but price ...
Traderfox06 Dear zeiiermantrading, I really like your approach combining adaptive averages with MACD in...
jacquesgermain Hello IASD it's normal , when this occurs, uncheck RSI and MFI line and click then the MAC...
emiliobercial Thank you very much for sharing!
Carlose estoy de acuerdo con IASD Esta muy bien el MAD y el indicador en el precio no se ven bien...
bousalahane merci pour le partage de cet l'indicateur, j'ai rajouté un autre indicateur pour faire une s...
KumoNoJuzza Hi Guys. This looks very interesting but don't overnight fees kill the profit when trading o...
ThaNoizy Yes, you cannot use CFDs on IG for Weekly strats you need to use their Index Futures, they h...
KumoNoJuzza Thanks. I did not know IG had Futures. I am always missing an info or a detail. I used to th...
Nicolas
12 months ago
3 RSI
3 RSI
2
Indicators
Violet Nicolas, you calculate iRSI, but don't use it. You show RSI in the returned values, which, a...
Nicolas Yes, that's an error. RSI instruction is set by default to 14 if you don't indicate it that'...
KumoNoJuzza Bonjour, @rominet44 pourrais tu expliquer à quoi sert le filtre: M8=average[11](close) // ...
Nicolas la moyenne mobile 11 période actuelle est ascendante ou descendante, on teste sa valeur vis ...
Patrice210 bonjour STANKO, effectivement la première ligne apparait en anomalie et je ne comprend pas v...
DELBERT Bonjour , Nicolas , je voudrais installer cet indicateur sur ma PRT , version 10.3 , mais je...
Nicolas En effet, il faut à minima une version 11. La 10.3 est tellement ancienne maintenant.. Je pe...
DELBERT Bonjour , Nicolas , merci pour ta réponse , je fais un essai et je verrais . Salutations .
Khaled Thank you Nicolas! Looks like TDI (Trader Dynamic Index). Interesting to give Exit Signal as...
Nicolas ColorBetween is an instruction added last year: https://www.prorealcode.com/documentation/co...
JohnScher Postscript: It's running in the live right now. One position after the other is opened. ...
ullle73 nice!! how's it been since your last post on going live? :)
thomas2004ch Hi, Is this strategy suitable for daily SPY? Regards
AndPar Buongiorno Nicolas, vorrei provare questo indicatore, ma quando lo inserisco in PRT mi vengo...
Nicolas Basta aggiungerlo al prezzo https://www.prorealcode.com/blog/video-tutorials/how-to-add-an-i...
Aragorna hello Nicolas, this indicator works with the last Beta version of PRT? Ive seen tha many in...
wally Hola soy nuevo en el mudo robots. Alguien seria tan amable de poner el archivo itf.file ya q...
Darren Nash I found this works well on the DOW
thomas2004ch Hi John, Is your strategy suitable for daily SPY? Regards
KAMJKAZE thanks, really interesting!
2c95 thanks, why do U prefer average than lowest ? to close under average does'nt mean another...
Stenozar Hi Sever, how can I visualize the coloured areas?
Sever Hi Stenozar, You need to add the color zones yourself , just go to Add Color Zone To set ...
Nicolas change the last line with: return v coloured(r,g,b) style(line,2), v+band coloured(168,168,1...
Paolo.B Thanks ... works as i wanted.
Kanamax Bonjour Nicolas, comme Paolo.B je souhaiterais utiliser cette indicateur au sein d'un code. ...
Boris Hi IVMcm, thanks for your amazing work. I have tested all of your indicators and use some of...
IV Mcm With pleasure and thanks!
ashiash how to use this indicator can i use tradingview platform
zilliq Thanks @Nicolas. I tried to use it as Trend in a proorder system, but don't know why, it doe...
Suzu Yuk He is right. MT and mavgMT are not defined and causing errors.....
AntoGH Bonjour peut-on backtester cela ? Et si vous l'avez fait pourriez vous nous donner le code.....
Nicolas désolé c'est un oubli de ma part, tu peux supprimer cette ligne, elle n'est plus utile dans ...
DELBERT Bonjour , Nicolas , merci pour ta réponse , je suis en effet avec PRT 10.3 , et j'ai bidouil...

Top