







Simple triple average with visual color
Hi all.
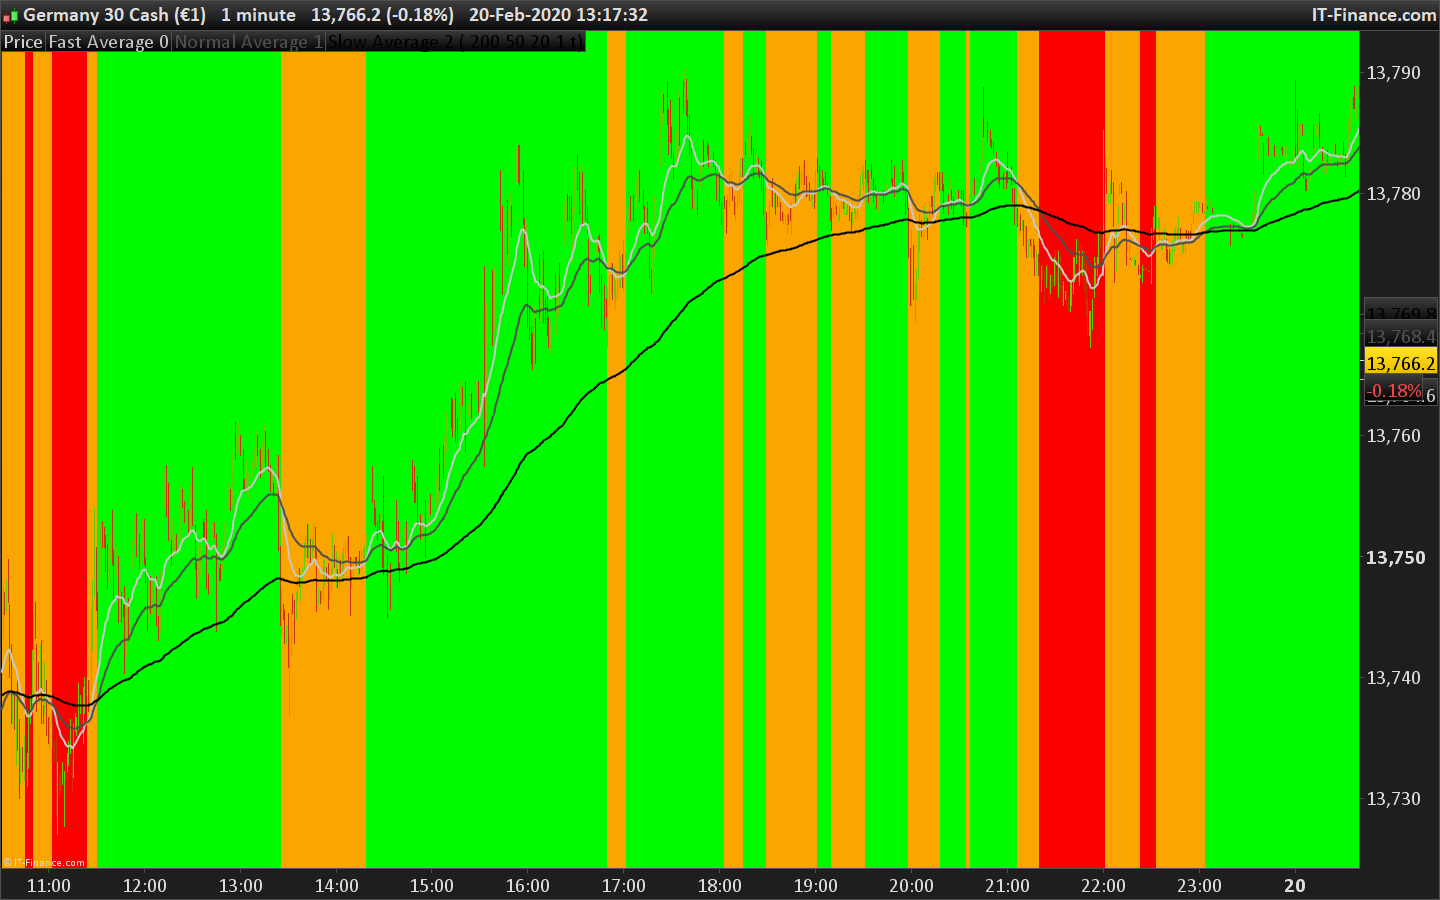
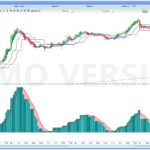
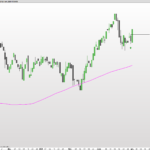
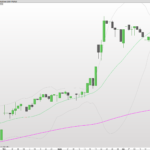
Simple trend indicator based on moving average, define your moving average parameter and watch the result. You can apply in on the price chart or below it to get the trend direction or pullback infos quickly.
green = fast moving average> normal and normal> slow.
red = fast moving average <normal and normal <slow.
yellow = green or red is not correct.
// Author: Tom's - Leofi
// Name: Terminus indicator
// Description: Trend average indicator

// Var indicator
emaSlow = Average[slow, type](close)
emaNormal = Average[normal, type](close)
emaFast = Average[fast, type](close)

// Logic
if (emaFast > emaNormal and emaNormal > emaSlow) then
 backgroundcolor(0,250,0)
elsif (emaFast < emaNormal and emaNormal < emaSlow) then
 backgroundcolor(250,0,0)
else
 backgroundcolor(250,165,0)
endif

// Boolean draw indicator
if (drawIndicator) then
 indicatorAlpha = 250
else
 indicatorAlpha = 0
endif

return emaFast coloured(200, 200, 200, indicatorAlpha) STYLE(line, 2) as "Fast Average 0", emaNormal coloured(80, 80, 80, indicatorAlpha) STYLE(line, 2) as "Normal Average 1", emaSlow coloured(0, 0, 0, indicatorAlpha) STYLE(line, 2) as "Slow Average 2"
Comments
You must be logged in to post a comment.

Is there some way whereby this indicator can be simplified by just having two imputs.? Imput 1: Fast MA. Imput 2: Slow MA. The background of the chart appears in light pastel GREEN when the Fast MA is above the Slow MA indicating a positive trend. When the Fast MA is below the Slow MA, the Background of the Chart turns LIGHT PINK indicating negative. The settings of the MA can be adjusted to the Period as well as the type of MA.
Hi,I am new on Prorealtime and coding.I downloaded the indi but I have it on a separate window.How can I plot it on the chart?Thanks in advance for the answer