

Dual Distance From Average indicator
I still debate myself between indicators that try to predict the future and those that illustrate a simplified view of the obvious market moves. I think that indicators that are very clear help in 2 ways: 1) indicating trades that are conceptually simple, that everybody understands and where you visualise your edge and 2) not forgetting to look at the basics.
This indicator won’t predict any future: it aims to put in a clear way what the market does, and it is conceptually very simple.
I use it for trend following. It measures the distances between price (smooth version of price) and moving averages (exponential, default of 70 and 200 as I use for Spanish stocks). The behaviour that I look for are bounces with (or close to) the 0 line. Interpretation: a bounce in the 0 line simply is the moving average acting as a support (if the bounce is a local minima) or resistance (if the bounce is a local maxima).
I use a smoothed version of the price (exp moving average, default 15) for 2 reasons: 1) close price on itself it gives too spiky signals that become more complex to interpret, 2) it is very common for price to pierce a moving average, but it is far less likely that a smooth version of close (i.e. another moving average) pierces it.
Finally, I print (red line) the distance between the 2 moving averages (70 and 200). This is simply to bring in the longer term trend (bull > 0, bear < 0) as well as MA crossings.
You may likely see this as a redundant indicator if you print your moving averages in the chart, and you will be right. This is just a way to bring moving average interpretation to a simplified form.
I hope someone finds it useful. Any feedback or comments are welcome!
// By camporan
// last updated: 20/07/19
// This indicator is a stacked indicator, handy to flatten the moving averages (default are 70 and 200). Areas of interest: when any of the 2 stacked lines approaches 0: very often they tend to bounce in (or close to) the 0 mark.
// Interpretation: very simple: if the indicators bounce close to 0 it shows that the moving average acts as support or resistence for the price.
// Often price itself may pierce the moving average, but a smoothed close (exponenital moving average) is significantly more precise bouncing.

//settings
DisplaySignals=1
m=70
m2=200
smoothFactor=15
//end of settings

// SECURITY CONTROLS :)
IF m < 1 THEN
 m = 1
ENDIF
IF m2 < 1 THEN
 m2 = 1
ENDIF
IF smoothFactor < 1 THEN
 smoothFactor = 1
ENDIF

media = ExponentialAverage[m](close)
media2 = ExponentialAverage[m2](close)
smoothClose = ExponentialAverage[smoothFactor](close)

distance = 100*(smoothClose-media)/close
distance2 = 100*(smoothClose-media2)/close

// Z-Score normalization could be useful if we compute the rolling STD in a long enough period
//Z = (smoothClose-media)/STD[m](close)
//distance = distance/STD[m](smoothClose)


ismin = distance > distance[1] AND distance[1] < distance[2]
ismax = distance < distance[1] AND distance[1] > distance[2]
if ismin AND DisplaySignals THEN
 drawarrowup(barindex,distance) coloured(30, 160,30)
ENDIF
if ismax AND DisplaySignals THEN
 drawarrowdown(barindex,distance) coloured(160,30,30)
ENDIF
ismin2 = distance2 > distance2[1] AND distance2[1] < distance2[2]
ismax2 = distance2 < distance2[1] AND distance2[1] > distance2[2]
if ismin2 AND DisplaySignals THEN
 drawarrowup(barindex,distance2) coloured(30, 160,30)
ENDIF
if ismax2 AND DisplaySignals THEN
 drawarrowdown(barindex,distance2) coloured(160,30,30)
ENDIF

// Estos 2 calculos de largas son los mismos. Usamos el 2do porque ya tenemos parte calculada (i.e. mejor performance)
//largas = media-media2
//largas = 100 * largas / close
largas = distance2 - distance

return distance as "distance", distance2 as "distance2", 0 as "cero", largas as "largas"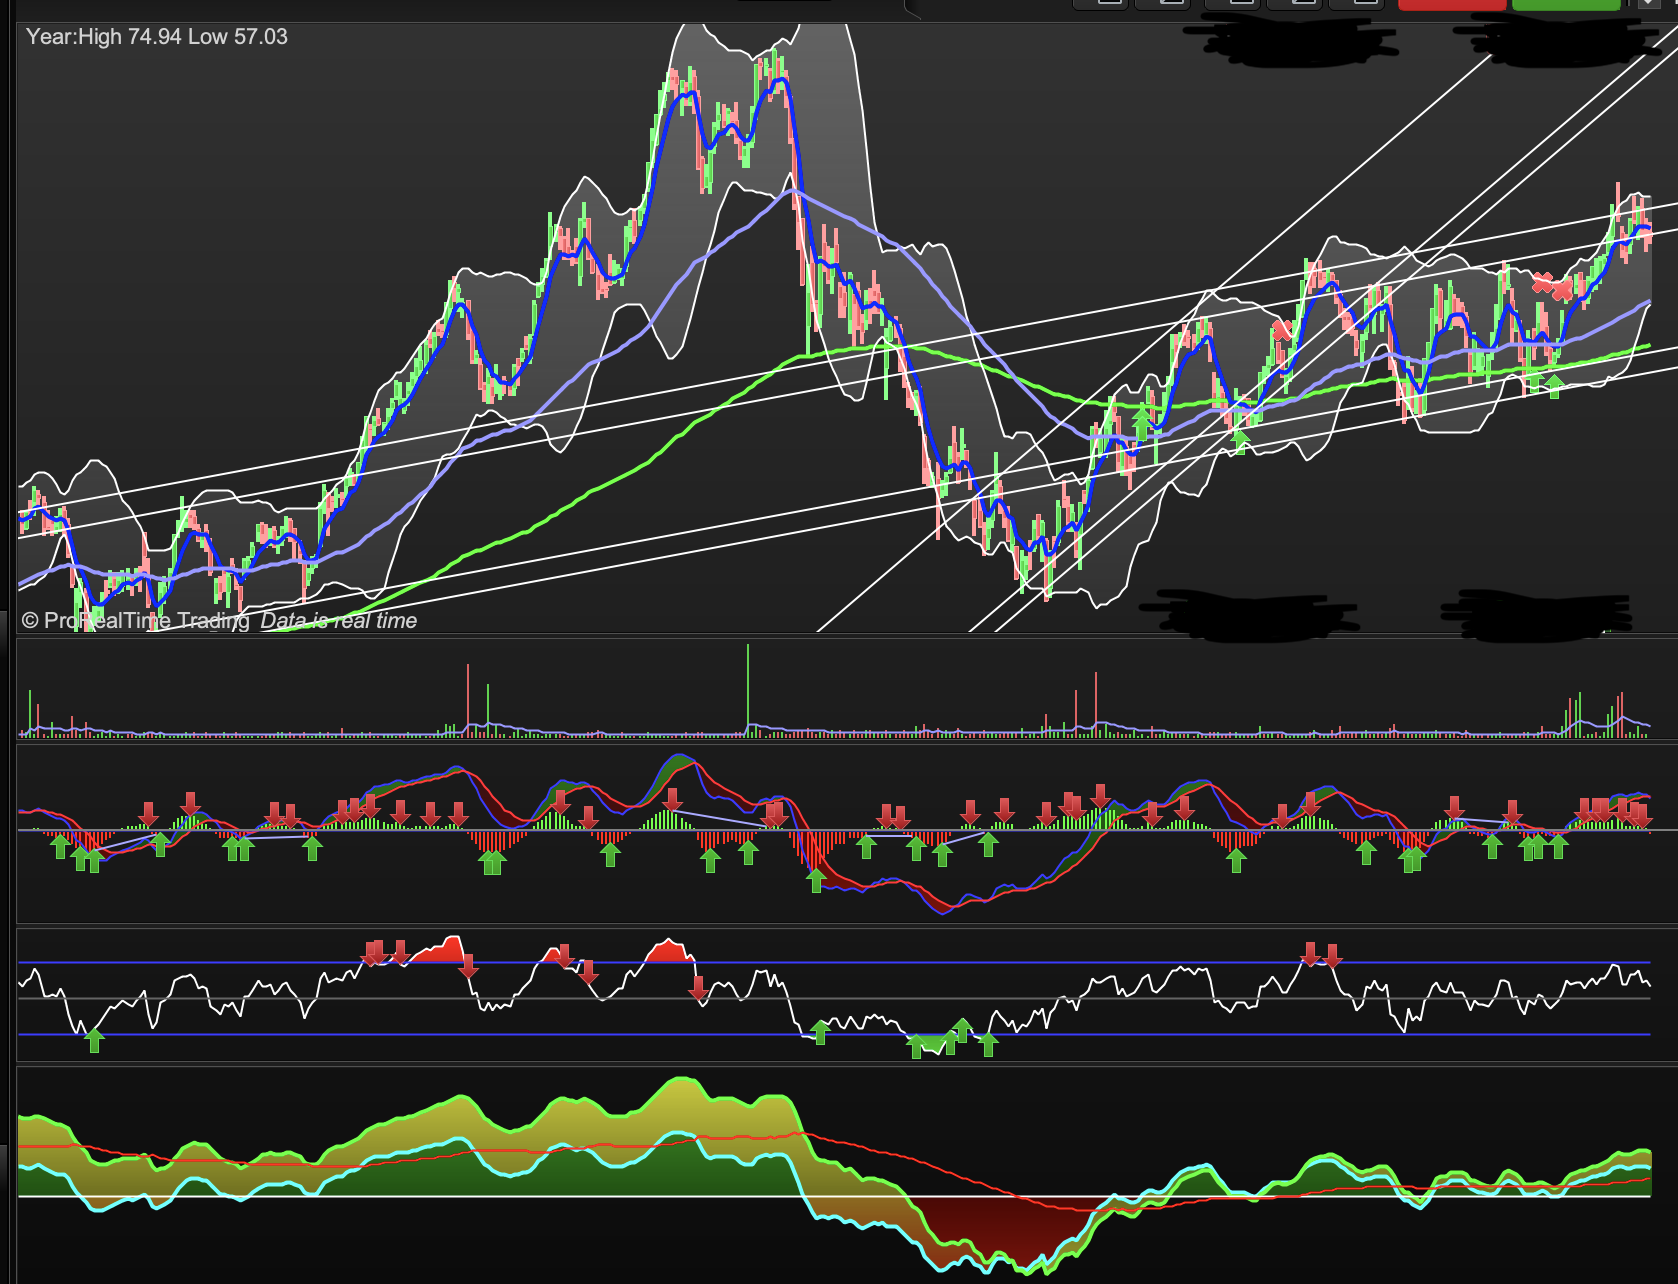