







Market Phase
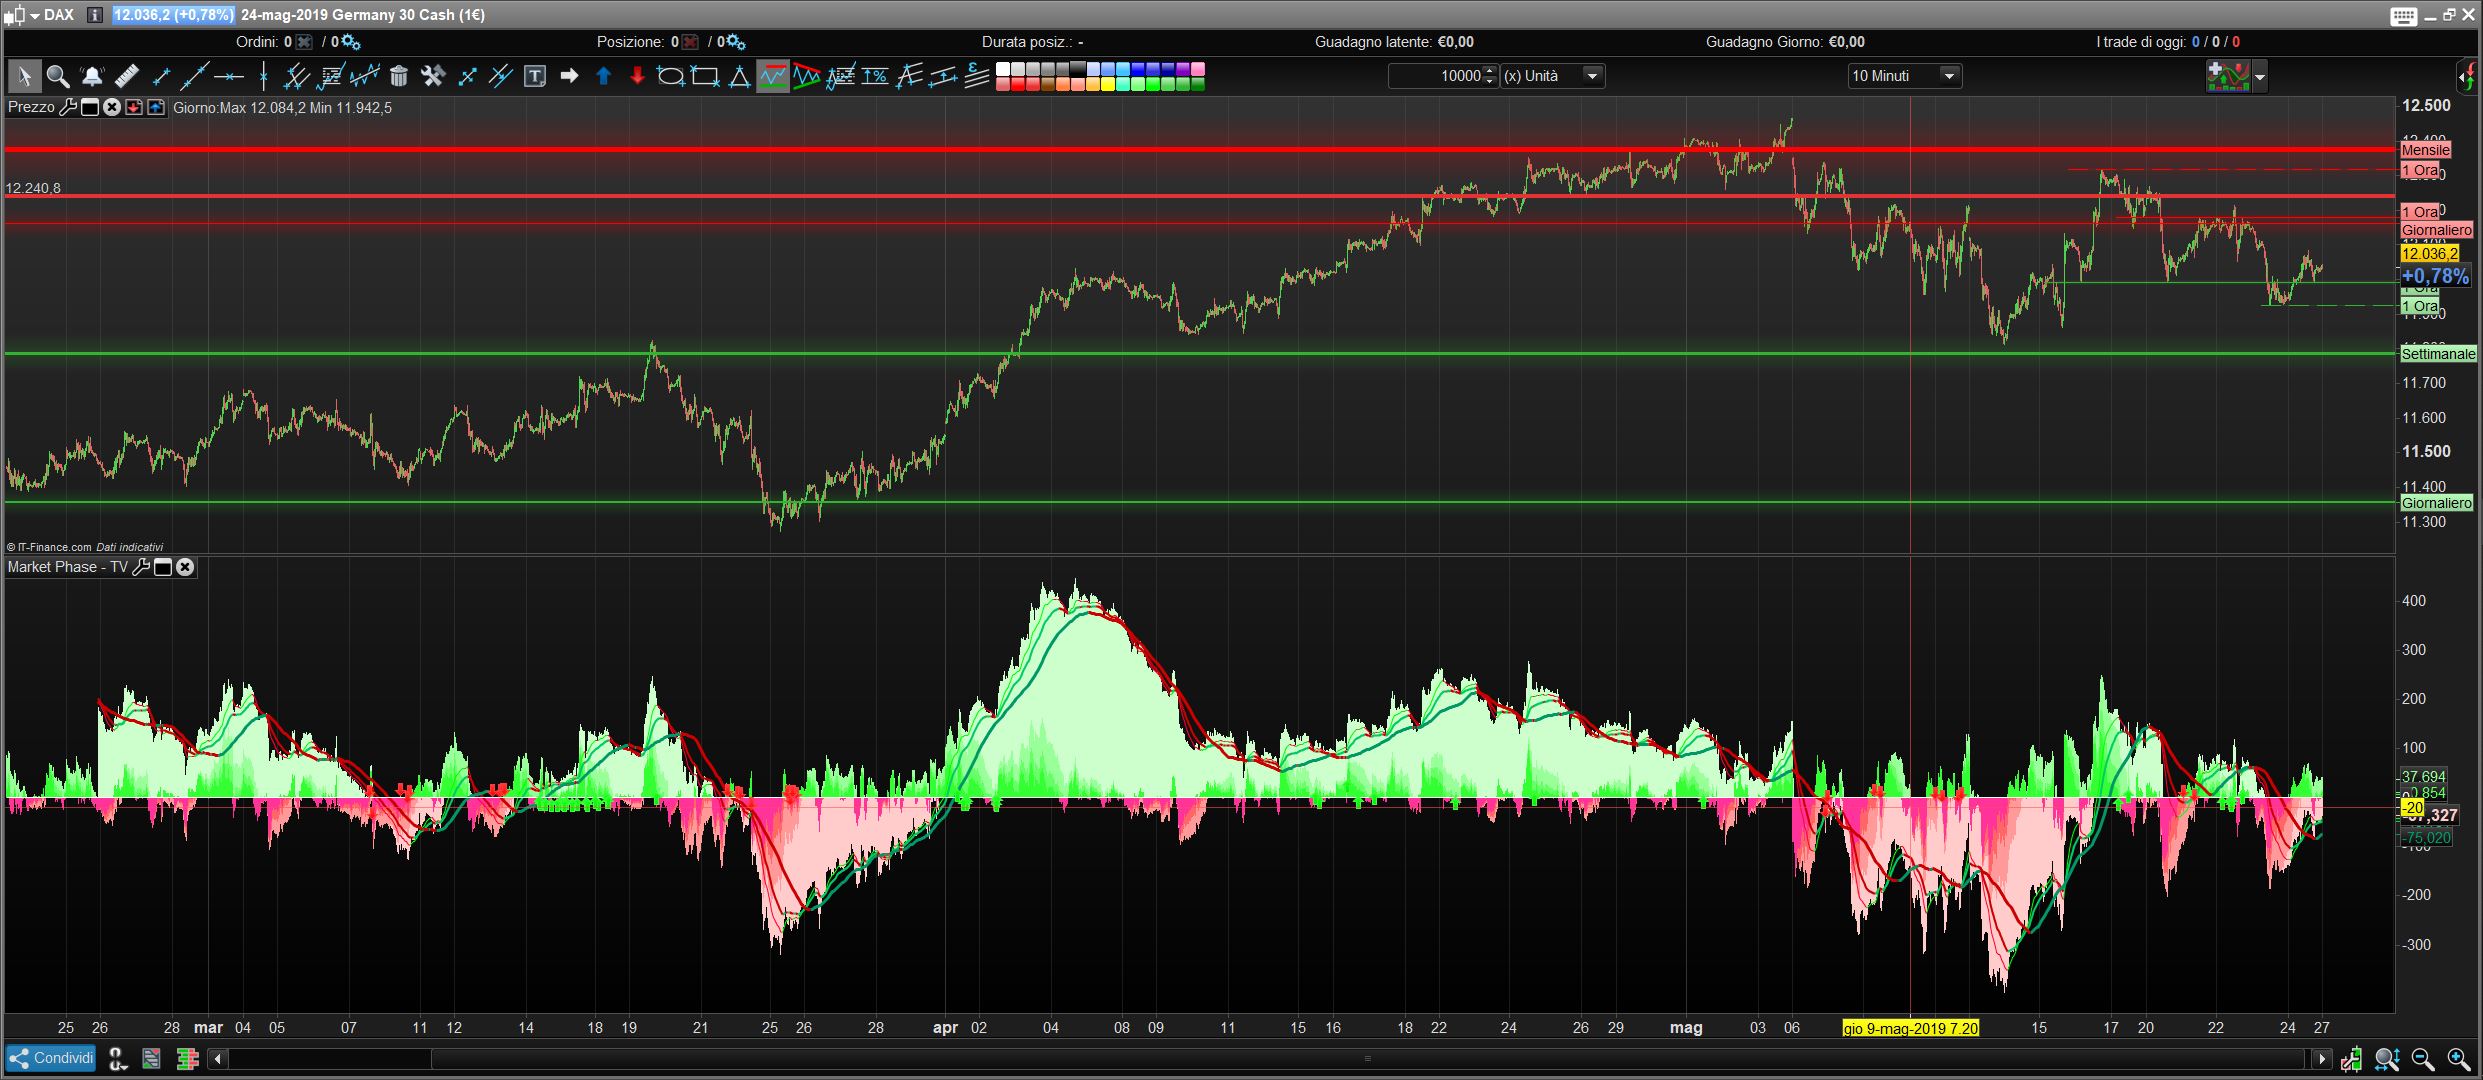
Inspired by a script seen on TradingView, I translated and adapted this indicator.
It shows the relation of price against different period moving averages.
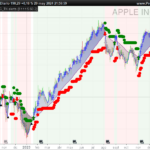
The arrows indicates possible retracements in a general trend direction, so they can be used as entry point.
No ground breaking math here, but I am finding very useful and some algo based on it is giving good results in demo live.
// This indicator shows the relation of price against different period ma's.
// When put in daily Timeframe it gives the 1400 Day (= 200 Weekly) and the 200 ,100 an 50 Daily.
// Features:
// - The lines show the 200,100 and 50 ma in relation to the 1400 ma.
// - The  arrows indicate possible (retracement) entry points
// Coded by AlexF

ma50=close-ExponentialAverage[50](close)
ma100=close-ExponentialAverage[100](close)
ma200=close-Average[200](close)
ma1400=close-Average[1400](close)
dma50=ma1400-ma50
dma100=ma1400-ma100
dma200=ma1400-ma200

if dma50<dma50[1] and dma100<dma100[1] and dma200<dma200[1] and ma50<0 and ma100<0 and ma200<0 and ma1400<0 then
trend=-1
elsif dma50>dma50[1] and dma100>dma100[1] and dma200>dma200[1] and ma50>0 and ma100>0 and ma200>0 and ma1400>0 then
trend=1
elsif trend<>1 or trend<>-1 then
trend=0
endif

if trend=-1 and ma50 crosses under 0 then
drawarrowdown(barindex,ma50+5*pipsize)coloured(255,0,0)
endif

if trend=1 and ma50 crosses over 0 then
drawarrowup(barindex,ma50-5*pipsize)coloured(0,255,0)
endif

return ma1400 as "1400 phase",ma200 as "200 phase", ma100 as "100 phase", ma50 as "50 phase", dma50 as "50", dma100 as "100", dma200 as "200", 0 as "zero"
Comments
You must be logged in to post a comment.


I added the (boring) coloring coding to this indicator, see below, so the indicator will immediatly be colored when you add it, // This indicator shows the relation of price against different period ma's. // When put in daily Timeframe it gives the 1400 Day (= 200 Weekly) and the 200 ,100 an 50 Daily. // Features: // - The lines show the 200,100 and 50 ma in relation to the 1400 ma. // - The arrows indicate possible (retracement) entry points // Coded by AlexF ma50=close-ExponentialAverage[50](close) ma100=close-ExponentialAverage[100](close) ma200=close-Average[200](close) ma1400=close-Average[1400](close) dma50=ma1400-ma50 dma100=ma1400-ma100 dma200=ma1400-ma200 if ma50 < 0 then r = 255 g = 0 b = 0 else r = 0 g = 128 b = 0 endif if ma100 < 0 then r1 = 192 g1 = 0 b1 = 0 else r1 = 51 g1 = 204 b1 = 51 endif if ma200 < 0 then r200 = 255 g200 = 51 b200 = 0 else r200 = 153 g200 = 255 b200 = 102 endif if ma1400 < 0 then r14 = 162 g14 = 43 b14 = 30 else r14 = 204 g14 = 255 b14 = 153 endif if dma50 < 0 then dr = 255 dg = 0 db = 0 else dr = 0 dg = 128 db = 0 endif if dma100 < 0 then dr1 = 192 dg1 = 0 db1 = 0 else dr1 = 51 dg1 = 204 db1 = 51 endif if dma200 < 0 then dr2 = 255 dg2 = 51 db2 = 0 else dr2 = 153 dg2 = 255 db2 = 102 endif return ma1400 coloured(r14,g14,b14)style(histogram) as "1400 phase",ma200 coloured(r200,g200,b200)style(histogram) as "200 phase", ma100 coloured(r1,g1,b1)style(histogram) as "100 phase", ma50 coloured(r,g,b)style(histogram) as "50 phase", dma50 coloured(dr,dg,db)style(line,3) as "50", dma100 coloured(dr1,dg1,db1)style(line,3) as "100", dma200 coloured(dr2,dg2,db2)style(line,3) as "200", 0 as "zero"


i just set the proorder like this: buy when 50/100/200 phase >0 and sell when under 0, good backtest but no effective trades in demo...strange thing...Ok to share :)