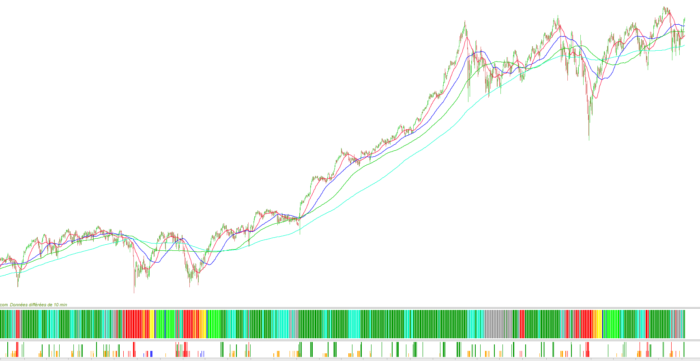
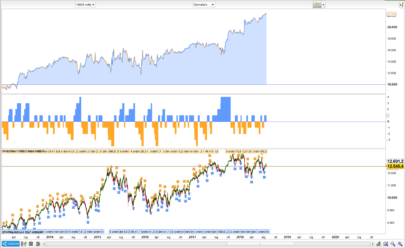
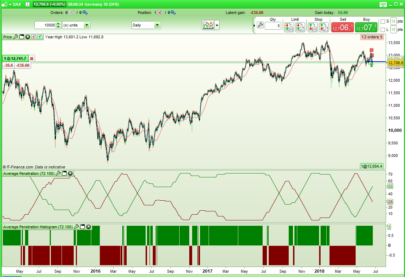
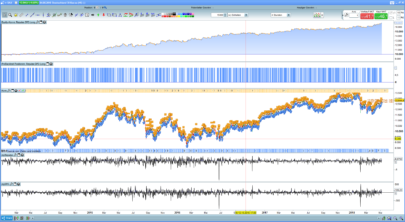
First indicator:
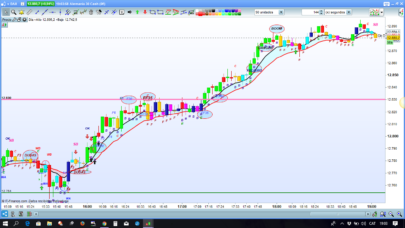
It uses moving averages, and following their knitting with the price itself gives an indication of the cycle. Trend indicator inspired by the diffusion curve innovation of Evrett Rogers (innovator, first follower, early majority, late majority, latecomer).
It gives an indication of the current cycle and thus maximize the probability of gain in this placing when the cycle is (yellow, opportunity) or (blue, reversal of trend).
From a more technical view, the opportunity phase is the the opening of the stochastic of the unit of higher timeframe (in other words one could have put indicator = stochastic with [50,10] and style (point, 0.5))
- The red phase is bearish, the price is below all moving averages.
- the orange phase is a technical rebound, ie the price has crossed the MM20 (this translates into a stochastic above the line H 50 but the macd still under the line H 0)
- the yellow phase is the opportunity phase, the price crosses the MM50, the macd crosses the line 0.
- the blue phase, reversal of the trend means that the price now crosses the MM100 while staying under the MM200, it is the so-called intermediate zone of “knitting”
- light green phase, the price is above the MM200, the trend is bullish but the MM50 (line 0 macd is still under the MM200).
- dark green phase, the price is above the MM200 is the MM50 also.
- green bottle phase, the price consolidates, either it passed under the MM20 or under the MM50 but it is above the MM100. This means a consolidation, a pullback or an end of cycle to come.
- the gray phase is neutral, ie the price is below the MM100 but above the MM200. it is either a cycle end, a wait before leaving congestion ….
|
1 2 3 4 5 6 7 8 9 10 11 12 13 14 15 16 17 18 19 20 21 22 23 24 25 26 27 28 29 30 31 32 33 34 35 36 37 38 39 40 41 42 43 44 45 46 47 48 49 50 51 52 53 54 55 56 57 58 59 60 61 62 63 64 65 66 67 68 69 70 71 72 73 74 75 76 77 78 |
//Indicateur tendance MM20=average[20](close) MM50=average[50](close) MM100=average[100](close) MM200=average[200](close) //rouge (baissier prix sous moyenne mobile 200) c1= (close<MM200) if c1 then Indicateur=1 r=250 g=0 b=0 ENDIF //orange( rebond technique) c2= c1 and(MM20<close) if c2 then Indicateur=1 r=255 g=160 b=0 ENDIF //jaune (phase1 nouveau cycle) c3= c1 and(MM50<close)and(mm50<mm200)and(close<mm200) if c3 then Indicateur=1 r=800 g=250 b=0 ENDIF //vert fluo ( phase 2 nouveau cycle) c4= (MM200<close)and(MM50<close)and(MM50<MM200) if c4 then Indicateur=1 r=0 g=300 b=0 ENDIF //vert foncé ( au dessus de tte moyenne mobile, cycle mur) C5= (MM200<MM50)and(MM50<close)and(MM20<close) if c5 then Indicateur=1 r=0 g=150 b=0 ENDIF //bleu (retournement de tendance) c6= (MM100<MM200) and(MM50<MM200)and (close<MM200)and(MM100<close)and(MM50<MM100) if c6 then Indicateur=1 r=0 g=0 b=300 ENDIF //bleu (retournement de tendance 2 ) c6bis= (MM100<MM200) and(MM50<MM200)and (close<MM200)and(MM50<close)and(MM100<MM50) if c6bis then Indicateur=1 r=0 g=0 b=300 ENDIF //gris (phase 5 affaiblissement ou retournement à la baisse, neutre) c7= (MM200<close) and(close<MM100)and (MM200<MM100)and(MM200<MM50) if c7 then Indicateur=1 r=150 g=150 b=150 ENDIF //bleu bouteille (consolidation) c8=(MM200<MM50)and(MM200<close)and(MM100<close)and((close<MM50)or(close<MM20)) if c8 then Indicateur=1 r=0 g=250 b=200 ENDIF RETURN indicateur coloured(r,g,b)style(histogram) |
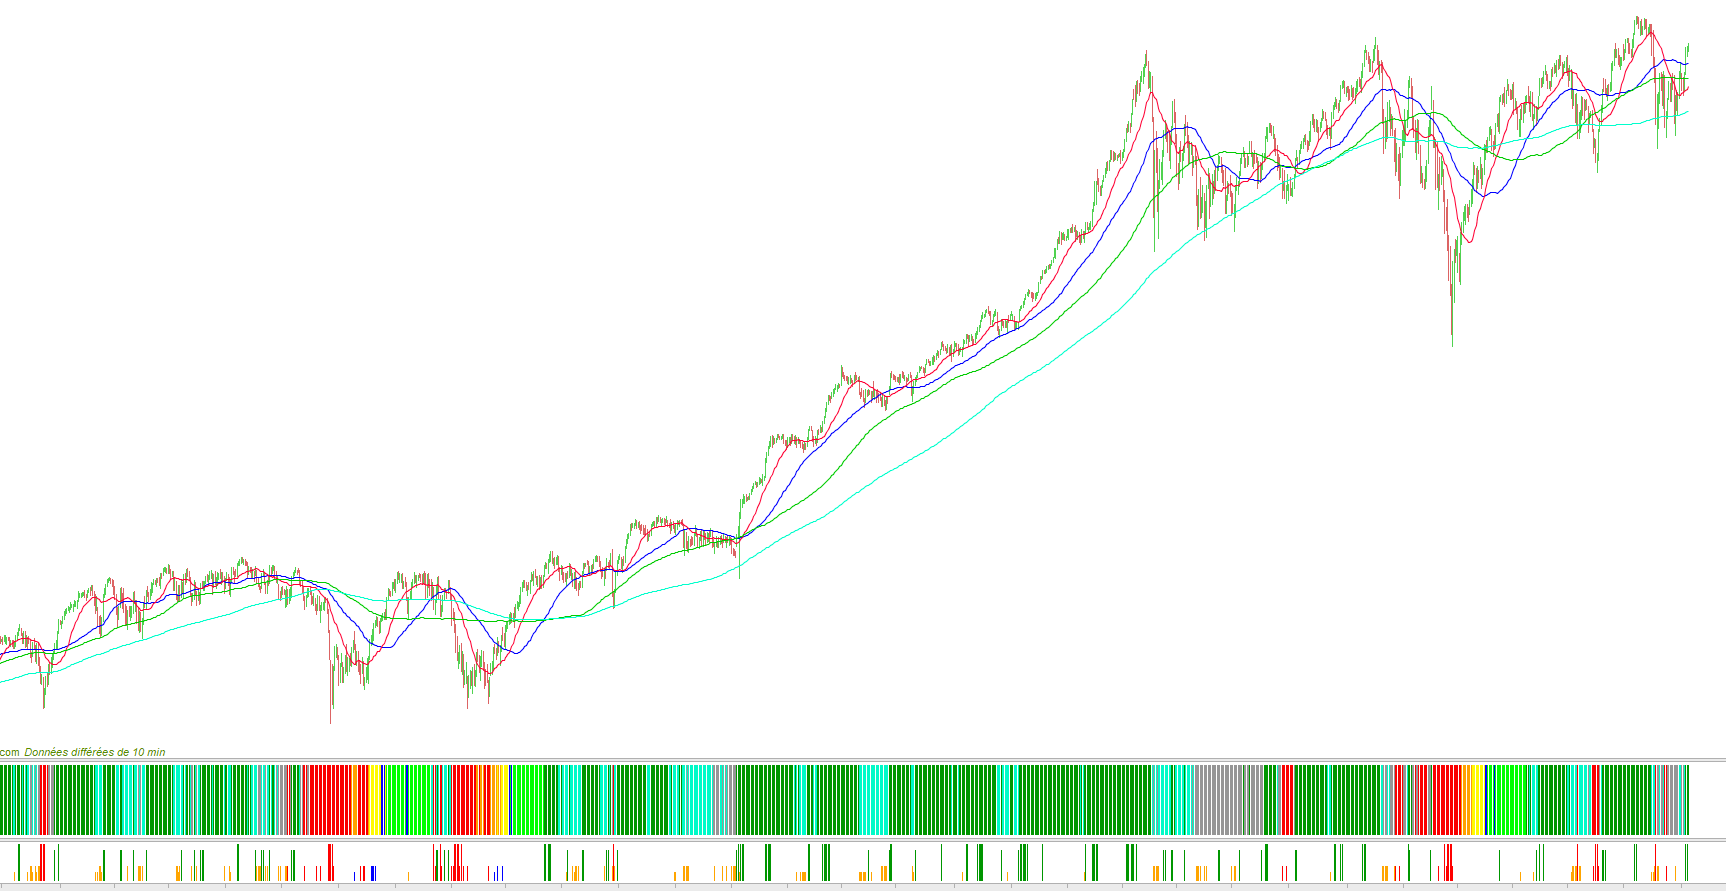
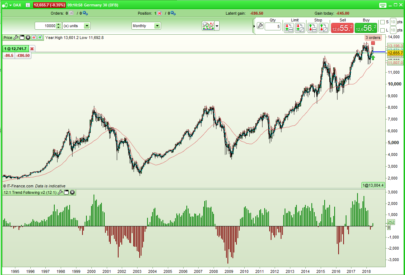
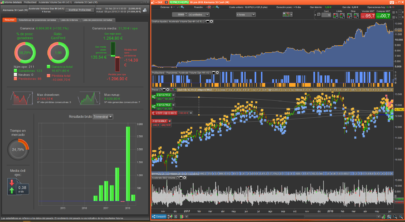
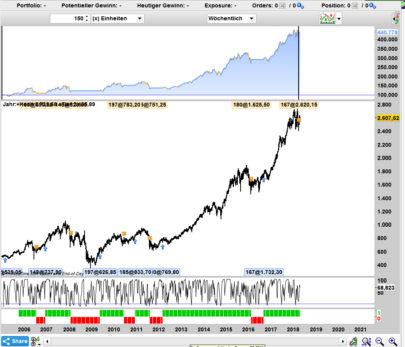
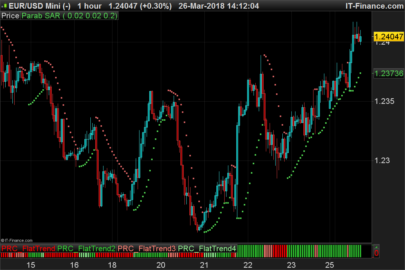
The second code is trading signals indicator telling us when to buy or sell the market:
Below the MM200 there is no buy signal. It starts in the technical rebound by plotting a small blue histogram and that until the opportunity phase, its corresponds to the price that hits the upper Bollinger and then gives a signal that an interest is brought to the title (the probability of winning is maximum). Then the signal becomes green, and the larger the histogram, the stronger the signal. There are also signals in the code related to the crossing of the MM50, this means that the macd returns the line 0 is that there is a probable bullish recovery.
|
1 2 3 4 5 6 7 8 9 10 11 12 13 14 15 16 17 18 19 20 21 22 23 24 25 26 27 28 29 30 31 32 33 34 35 36 37 38 39 40 41 42 43 44 45 46 47 48 49 50 51 52 53 54 55 56 57 58 59 60 61 62 63 64 65 66 67 68 69 70 71 72 73 74 75 76 77 78 79 80 81 82 83 84 85 86 87 88 89 90 91 92 93 94 95 96 97 98 99 100 101 102 103 104 105 106 107 108 109 110 111 112 113 114 115 116 117 118 119 120 121 122 123 124 125 126 127 128 129 130 131 132 133 134 135 136 137 138 139 140 141 142 143 144 145 146 147 148 149 150 151 152 153 154 155 156 157 158 159 160 161 162 163 164 165 166 167 168 169 170 171 172 173 174 175 176 177 178 179 180 181 182 183 |
Indicateur=0 MM20=average[20](close) MM50=average[50](close) MM30E=exponentialaverage[30](close) MM200=average[200](close) MM100=average[100](close) MM4=average[4](close) p = 20 dev = 2 BollSup =Average[p](close)+dev*std[p](close) BollInf = Average[p](close)-dev*std[p](close) c000= (MM50<MM200)and(MM30E<MM50)and(MM200<close)and(MM4<MM200) if c000 then Indicateur=1 r=0 g=150 b=0 ENDIF c00= (MM200<close) and(MM30E<MM50)and( MM50<close)and(MM4<MM50) if c00 then Indicateur=1 r=0 g=150 b=0 ENDIF c0= (MM200<close) and (MM200<MM50)and(MM50<MM30E)and(MM30E<close)and(MM4<MM30E) if c0 then Indicateur=1 r=0 g=150 b=0 ENDIF //vert, foncé signal achat c1= (BollSup<close)and (MM200<MM50)and(MM50<close)and(MM20<close) if c1 then Indicateur=1.2 r=0 g=150 b=0 ENDIF //vert, fonce signal achat tendance precoce (vert fluo) c2biss= (BollSup<high) and (MM200<close)and(MM50<close)and(MM50<MM200)and(close<open) if c2biss then Indicateur=0 r=0 g=0 b=0 ENDIF //vert, fonce signal achat tendance precoce (vert fluo) c2bis= (BollSup<close) and (MM200<close)and(MM50<close)and(MM50<MM200) if c2bis then Indicateur=1 r=0 g=150 b=0 ENDIF //bleu, signal préachat pendant rebond technique (orange) c3= (close<MM200)and(MM20<close)and (BollSup<high) if c3 then Indicateur=0.3 r=0 g=0 b=300 ENDIF //bleu, signal preachat pendant phase relance (jaune) c4=(MM50<close)and(mm50<mm200)and(close<mm200)and (BollSup<high) if c4 then Indicateur=0.5 r=0 g=0 b=300 ENDIF //bleu, signal preachat pendant phase de retournement (bleu) c5= (MM100<MM200) and(MM50<MM200)and (close<MM200)and(MM100<close)and(MM50<MM100)and (BollSup<high) if c5 then Indicateur=0.5 r=0 g=0 b=300 ENDIF //bleu, signal preachat tendance neutre (gris) c7= (MM200<close) and(close<MM100)and (MM200<MM100)and(MM200<MM50)and (BollSup<high) if c7 then Indicateur=0.3 r=0 g=0 b=300 ENDIF //orange, signal prevente en tendance consolidation (vert bouteille) c8bis=(MM200<MM50)and(MM200<close)and(MM100<close)and((close<MM50)or(close<MM20))and(low < BollInf) if c8bis then Indicateur=0.5 r=255 g=165 b=0 ENDIF //orange, signal prevente en tendance consolidation (vert bouteille) c8bis=(MM200<MM50)and(MM200<close)and(MM100<close)and((MM50<close)and(close<MM20))and( BollInf<close)and(low < BollInf) if c8bis then Indicateur=0.3 r=255 g=165 b=0 ENDIF //orange, signal prevente en tendance consolidation (vert bouteille) c8biss=(MM200<MM50)and(MM200<close)and(MM100<close)and((MM50<close)and(close<MM20))and( close<BollInf) if c8biss then Indicateur=0.3 r=255 g=165 b=0 ENDIF //orange, signal prevente en tendance neutre (gris) c9= (MM200<close) and(close<MM100)and (MM200<MM100)and(MM200<MM50)and (low<BollInf)and(MM200<low) if c9 then Indicateur=0.5 r=255 g=165 b=0 ENDIF //rouge, signal prevente en tendance neutre (gris) c9bis= (MM200<close) and(close<MM100)and (MM200<MM100)and(MM200<MM50)and (low<BollInf)and(low<MM200) if c9bis then Indicateur=0.5 r=255 g=165 b=0 ENDIF //orange, signal prevente en tendance neutre (gris) c9biss= (MM200<close) and(close<MM100)and (MM200<MM100)and(MM200<MM50)and (close<BollInf) if c9biss then Indicateur=0.5 r=255 g=165 b=0 ENDIF //rouge, signal vente en tendance declin (rouge) c10= (close<MM200)and (low<BollInf) if c10 then Indicateur=0.5 r=255 g=0 b=0 ENDIF //rouge, signal vente en tendance declin (rouge) c10bis= (close<MM200)and (close<BollInf) if c10bis then Indicateur=1.2 r=255 g=0 b=0 ENDIF //orange, signal vente en tendance declin (rouge)***** c10biss= (MM200<close)and (low<BollInf)and(MM50<close) if c10biss then Indicateur=0.3 r=255 g=165 b=0 ENDIF //orange, signal prevente en tendance consolidation (vert bouteille) c8bisss=(MM200<MM50)and(MM200<close)and(MM100<close)and((MM50<close)and(close<MM20))and( BollInf<close)and(low<BollInf) if c8bisss then Indicateur=0.3 r=255 g=165 b=0 ENDIF //vert bouteille signal achat c8bisbis=(MM200<MM50)and(MM200<close)and(MM100<close)and((close<MM50)or(close<MM20))and( BollSup<high)and(open<close) if c8bisbis then Indicateur=0.5 r=0 g=0 b=300 ENDIF RETURN indicateur coloured(r,g,b)style(histogram) |
Share this
No information on this site is investment advice or a solicitation to buy or sell any financial instrument. Past performance is not indicative of future results. Trading may expose you to risk of loss greater than your deposits and is only suitable for experienced investors who have sufficient financial means to bear such risk.
ProRealTime ITF files and other attachments :
Find other exclusive trading pro-tools on ![]()
PRC is also on YouTube, subscribe to our channel for exclusive content and tutorials


Avec plaisir !
Great combination, easy to use and quite accurate.
Bonjour Anton … j’ai un message d’erreur … PRT V10.3 ou V11… ne semble pas reconnaître “(proche)” … “ligne 3 commande inconnue” ?
Bonsoir Anthon et merci pour les indicateurs qui semble particulièrement pertinents …
Pourrais-tu nous indiquer où trouver les screener de la vidéo qui vont avec les indicateurs … mais en version “copier-coller” ou “importer” 😉
Bon WE
Salut à tous et merci !
Bonjour Anthon … pourrais-tu me communiquer l’adresse ou le nom de ta chaine YOUTUBE … je ne la trouve pas ?
a premiere vue la chaine youtube n’éxiste plus
Hi all, nice indicator, only i dont get the ‘trendindicator’ with the colorfull stripes working on the end of day email S&P.. I only see a box below with a horizontal line with colourchanges.. What should i do? Many thanks!
Bonsoir, je découvre PRT et je n’arrive pas a afficher le meme résultat pour l’indicateur de tendance. J’ai juste une ligne droite qui change de couleur. Je n’arrive pas a avoir le graphique sous forme d’histogramme.
Comment faire ?
Merci pour votre aide
Hello, hello….je commence le trading et découvre par la même occasion le codage….et ce n’est pas une mince affaire pour un débutant comme moi!! je me dois de remercier ceux et celles qui se donnent la peine d’établir et de les partager, des indics, screeners, backtest, etc….c’est un travail de Titan (pour ma part!!)…. je trouve cet indicateur très pertinent…. Merci à tous!
Merci, ça fait plaisir !
Bonjour tout le monde ! Dans l’indicateur de tendance, j’ai du mal à saisir la nuance entre bleu (retournement de tendance) et bleu (retournement de tendance 2) ? Quelqu’un pourrait-il éclairer ma lanterne ? Est-il question d’un retournement à la baisse d’une part et à la hausse d’autre part ? Merci d’avance