TD REI

TD REI

Range Expansion Index

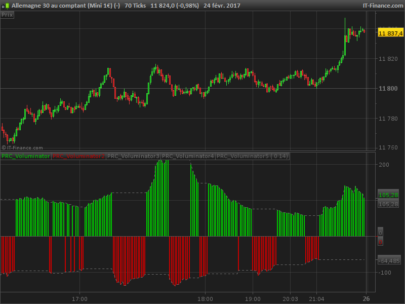
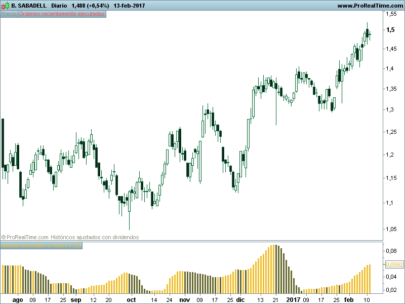
The DeMark Range Expansion Index is a market-timing oscillator described in DeMark on Day Trading Options, by T.R. DeMark and T.R. Demark, Jr., McGraw Hill, 1999. The oscillator is arithmetically calculated and is designed to overcome problems with exponentially calculated oscillators, like MACD. The TD REI oscillator typically produces values of -100 to +100 with 45 or higher indicating overbought conditions and -45 or lower indicating oversold. Here is how Tom DeMark describes the calculation of Range Expansion Index:

“The first step of the calculating the REI is to add the respective differences between the current day’s high and the high two days earlier and the current day’s low and the low two days earlier. These values will be positive or negative depending on whether the current day’s high and low are greater or less than the high and low two days earlier. To prevent buying or selling prematurely into a steep price decline or advance, two additional conditions should be met to qualify a positive or negative value on a particular day: 1) either the high two days earlier must be greater than or equal to the close seven or eight days ago, or the current day’s high must be greater than or equal to the low five or six days ago; 2) either the low two days earlier must be less than or equal to the close seven or eight days ago, or the current day’s low must be less than or equal to the high five or six days ago. If either of these conditions are not satisfied, a zero value is assigned to that day. If they both are, the daily values (the differences between the highs and lows) are summed , and the specific value for that next day is determined. Next, all the positives and negative values are added together over a five-day period. This value is then divided by the absolute value price movement of each day over the five-day period. The numerator of the calculation can be either positive, negative or zero, because each day’s value is summed for five days, but the denominator is always positive because it is only concerned with the differential price movement itself. This value is then multiplied by 100. Consequently, the REI can fluctuate between +100 and -100.”

Parameters

HighMom (HighMom = 0)

LowMom (LowMom = 0)

Cond1 (Cond1 = 0)

Cond2 (Cond2 = 0)

Cond3 (Cond3 = 0)

Cond4 (Cond4 = 0)

Cond (Cond = 0)

Num (Num = 0)

Den (Den = 0)

TDREI (TDREI = 0)

Share this

Risk disclosure:

No information on this site is investment advice or a solicitation to buy or sell any financial instrument. Past performance is not indicative of future results. Trading may expose you to risk of loss greater than your deposits and is only suitable for experienced investors who have sufficient financial means to bear such risk.

ProRealTime ITF files and other attachments : How to import ITF files into ProRealTime platform?

PRC is also on YouTube, subscribe to our channel for exclusive content and tutorials

avatar
Register or

Likes

avatar avatar avatar avatar avatar
Related users ' posts
Nicolas Please post any question on forums, thanks.
Lavallette Bonjour Nicolas. J'utilise la version 11 et moi aussi j'ai une ligne horizontale malgré l'a...
Nicolas il faut modifier la ligne 20 avec: if adaptive=1 and averagePeriod > 1 and barindex>(...
Nicolas
8 years ago
supertiti bonjour à tous J'utilise cet indicateur depuis plusieurs mois, une fois règlé "K" à sa conv...
Nicolas
8 years ago
GraHal Forked code I mention above is here ... GraHal wrote: So below is the PRC Stochastic RSI v...
GraHal Try again (quite limited what you can do as Comments in the Library) https://www.prorealco...
AutoFlanders Thanks GraHal, that's what i was looking for
Doctrading Nice Job ! Here is my version of the code :  KBO = 0 Tenkansen = (highest[9](high)+lowe...
gefinance Thanks for this code. The only thing left missing is the time lapse, otherwise, lots of old...
dakaodo Hi, Wilko. Acc to the original FRAMA paper by Ehlers, Ehler's own code only takes inputs for...
dakaodo For reference, here is Ehlers' original paper: http://www.mesasoftware.com/papers/FRAMA.p...
dakaodo Here is the code with only SC included, per ETFHQ. pri=customclose //len>=4, even on...
Nicolas Hi, there's no reason why it should not work on a 5 min chart. Just apply the indicator on y...
Percygreen77 good evening sorry for my english but the indicator don't work can you help me i have 10.3 v...
Nicolas By adding it on price, it should display the pattern detection on the price chart, and not ...
Nicolas
8 years ago
soulintact Thank you very much Nicolas for this great indicator. I have tried to apply it to a trading ...
laitus No funciona este indicador ¿¿?? ¿Alguien sabe por qué?
Nicolas
8 years ago
Better Volume
Better Volume
39
Indicators
Keyeming Hello Nicolas; not sure to undersntad line 167, and in the video I d'ont remember that the a...
Nicolas I don't know, this code is 6 years old and I made a 1:1 translation of the provided code by ...
Alai-n https://emini-watch.com/free-stuff/volume-indicator/
Nicolas
8 years ago
T3 Velocity
T3 Velocity
16
Indicators
tatankayotanka As you can do to set a marker directly in the price property page and then view it such as m...
Nicolas It may be a good idea to discuss this in the forum instead. Please open a new topic in probu...
Wester Hi, is this more or less the same as the TTM Squeeze indicator (john carter)
Nicolas I don't know really, just like you I found a lot of different formulas there and there on th...
CarlosFC  Thanks a lot Nicolas. I posted it. Carlos.
besho hello Nicolas how can i get this indicator i tried copy and paste the code but i didn't...
Guibourse Hi ! I am asking once again for your help : would it be possible to use the ATR as a "take p...
Tradingrob Many thanks for the indicator, however if the price is below the indicator, then the indicat...
aldtrading Merci pour ton travail ! J'ai de bons résultats en utilisant cet indicateur
Etienne Hi, I'm quite late in this thread. I'd just like to propose an enhancement because this in...
Nicolas Thanks Etienne.
Bard Hi Nicolas, I wanted to make this scaled indicator above between -1 and +1 instead of 0 to +...
Nicolas The code is correct, don't know if the label and color are the same as other trading softwar...
peppe novellino Hi Nicolas, the settings of the alligators are not editable. How can I change it? Thanks in ...
pabo_swe I got very bad performance with this script, it was slow... it seems like if one breaks out ...
juju333 Merci Nicolas, j'utilisais avec bonheur ce code dans la 10.3, il ne tourne plus dans la v11....
Nicolas Remplacer les lignes 11 et par 12 avec: yearlyHigh = Highest[max(1,BarIndex - lastYearBarI...
juju333 merci !!!
Madrosat Bonjour Nicolas Je souhaiterais faire colorier le fond du graphique supérieur en vert lorsq...
Nicolas Merci d'ouvrir un sujet dans le forum approprié.
Nwab Hello Mr Nicolas.. Please how can I set this up as an indicator to work on mt5. Your guidan...
Nicolas
9 years ago
Kuskus Starlight
Kuskus Starlight
5
Indicators
luigiR sara ovviamente mia premura condividerla nn appena sara pronta
Nicolas Why are posting your question here?! Its not related to this indicator...Please use the foru...
luigiR Hi Nicholas, excuse me, but I don't know about this opportunity, I try, sorry again
larouedegann best with this hour IF TIME =081000 THEN plushaut=highest[2](high) plusbas = lowest[2](lo...
CanAny1Trade Hi! I'm trying to put together a similar indicator but struggling. I want to mark the NY Pit...
jeanphi0034 Hello, I would like to use the QQE indicator which is based on smooth RSI as far as I unders...
ilstefano Bonjour Nicolas, te serait il possible de rajouter la fast ATR manquante dans le code? Merci
Nicolas Désolé je ne comprends pas la question ?

Top