







RSI Laguerre self adjusting gamma with Fractals Energy
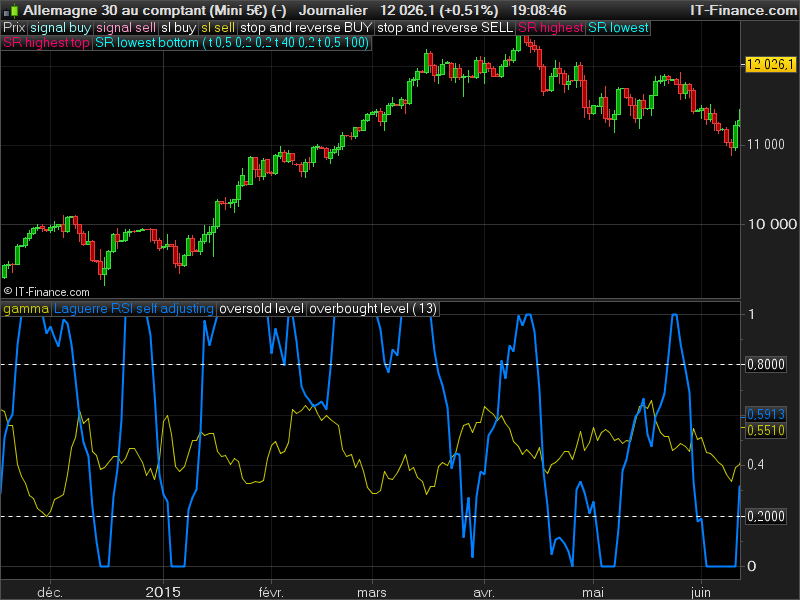
The Laguerre RSI technical indicator is a trend indicator based on a Laguerre filter.
The Laguerre indicator plots the weighted price trend line in a different window in the price graph window.
The Laguerre RSI indicator plots the weighted RSI indicator value filtered with a Laguerre filter. The gamma sensibility of the Laguerre filter is self adjusted with the “fractals energy” as the original author describes it.
This “energy” is the curve of yellow color, while the Laguerre RSI adjusted with this energy is the blue one.
Indicator translated from TOS code, requested on English forum.
//PRC_LaguerreRSI Fractals Energy | indicator
//23.03.2017
//Nicolas @ www.prorealcode.com
//Sharing ProRealTime knowledge
//translated from original code from TOS (author:Mobius)

// --- settings
//nFE=13 //length for Fractal Energy calculation
// --- end of settings

// Calculations
if barindex>nFE then
 o = (open + close[1]) / 2
 hh = Max(high, close[1])
 ll = Min(low, close[1])
 c = (o + hh + ll + close) / 4
 gamma = Log(Summation[nFE](Max(high, close[1]) - Min(low, close[1])) / (Highest[nFE](high) - Lowest[nFE](low)))/ Log(nFE)

 L0 = (1 - gamma) * c + gamma * L0[1]
 L1 = -gamma * L0 + L0[1] + gamma * L1[1]
 L2 = -gamma * L1 + L1[1] + gamma * L2[1]
 L3 = -gamma * L2 + L2[1] + gamma * L3[1]
 if L0 >= L1 then
  CU1 = L0 - L1
  CD1 = 0
 else
  CD1 = L1 - L0
  CU1 = 0
 endif

 if L1 >= L2 then
  CU2 = CU1 + L1 - L2
  CD2 = CD1
 else
  CD2 = CD1 + L2 - L1
  CU2 = CU1
 endif

 if L2 >= L3 then
  CU = CU2 + L2 - L3
  CD = CD2
 else
  CU = CU2
  CD = CD2 + L3 - L2
 endif

 if CU + CD <> 0 then
  lagRSI = CU / (CU + CD)
 else
  lagRSI=0
 endif
endif

RETURN gamma coloured(200,200,0) as "gamma", lagRSI coloured(0,128,255) style(line,2) as "Laguerre RSI self adjusting", 0.2 style(dottedline,1) as "oversold level", 0.8 style(dottedline,1) as "overbought level"
Comments
You must be logged in to post a comment.


How can I trade with this "Yellow Energy"?

Hi Nicolas, why cant the codes copy and past in to prorealttime. I want to try, but I have no time to write the updates that done by others. I think that would be positive for everyone.
Regars
Eva

Pour cela, il suffit d'intercaler ces lignes de codes à la ligne 18 (sous le calcul de gamma):
hh=highest[gammaP](gamma)*0.9
ll=lowest[gammaP](gamma)*1.1
et de remplacer la ligne 54 (RETURN) avec celle-ci :
RETURN gamma coloured(200,200,0) as "gamma", lagRSI coloured(0,128,255) style(line,2) as "Laguerre RSI self adjusting", 0.2 style(dottedline,1) as "oversold level", 0.8 style(dottedline,1) as "overbought level", hh, llJ'ai introduit la variable "gammaP" qui permet de modifier à convenance le retour en arrière pour déterminer les résidus de la distribution du gamma entre les bornes hautes et basses de ce calcul. Il faudra donc bien entendu ajouter cette variable en externe pour la faire varier à convenance. Bon amusement :)
Si l'indicateur n'est pas normé (ou atteint rarement les limites), il faudrait deux lignes de séparation qui détermineraient, sur les n derniers mois, les 10 % des valeurs les plus élevés et plus basses afin de détecter automatiquement ensuite les configurations "le ressort va bientôt se détendre"/"le mouvement s'essouffle". Une sorte de canal du gamma mais dont les limites horizontales dépendent de l'historique des valeurs.
C'est dommage, cette histoire d'énergie fractale bousille complètement la précision de l'indicateur original : if barindex > 0 then L0 = (1 - gamma) * close + gamma * L0[1] L1 = -gamma * L0 + L0[1] + gamma * L1[1] L2 = -gamma * L1 + L1[1] + gamma * L2[1] L3 = -gamma * L2 + L2[1] + gamma * L3[1] if L0 >= L1 then CU1 = L0 - L1 CD1 = 0 else CD1 = L1 - L0 CU1 = 0 endif if L1 >= L2 then CU2 = CU1 + L1 - L2 CD2 = CD1 else CD2 = CD1 + L2 - L1 CU2 = CU1 endif if L2 >= L3 then CU = CU2 + L2 - L3 CD = CD2 else CU = CU2 CD = CD2 + L3 - L2 endif if CU + CD 0 then lagRSI = CU / (CU + CD) else lagRSI = 0 endif endif RETURN lagRSI as "LR"