Short explanation of the SSL Hybrid Indicator components
SSL1 / Baseline channel
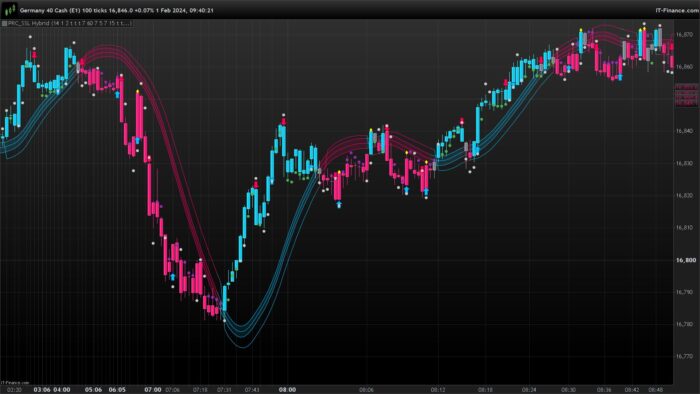
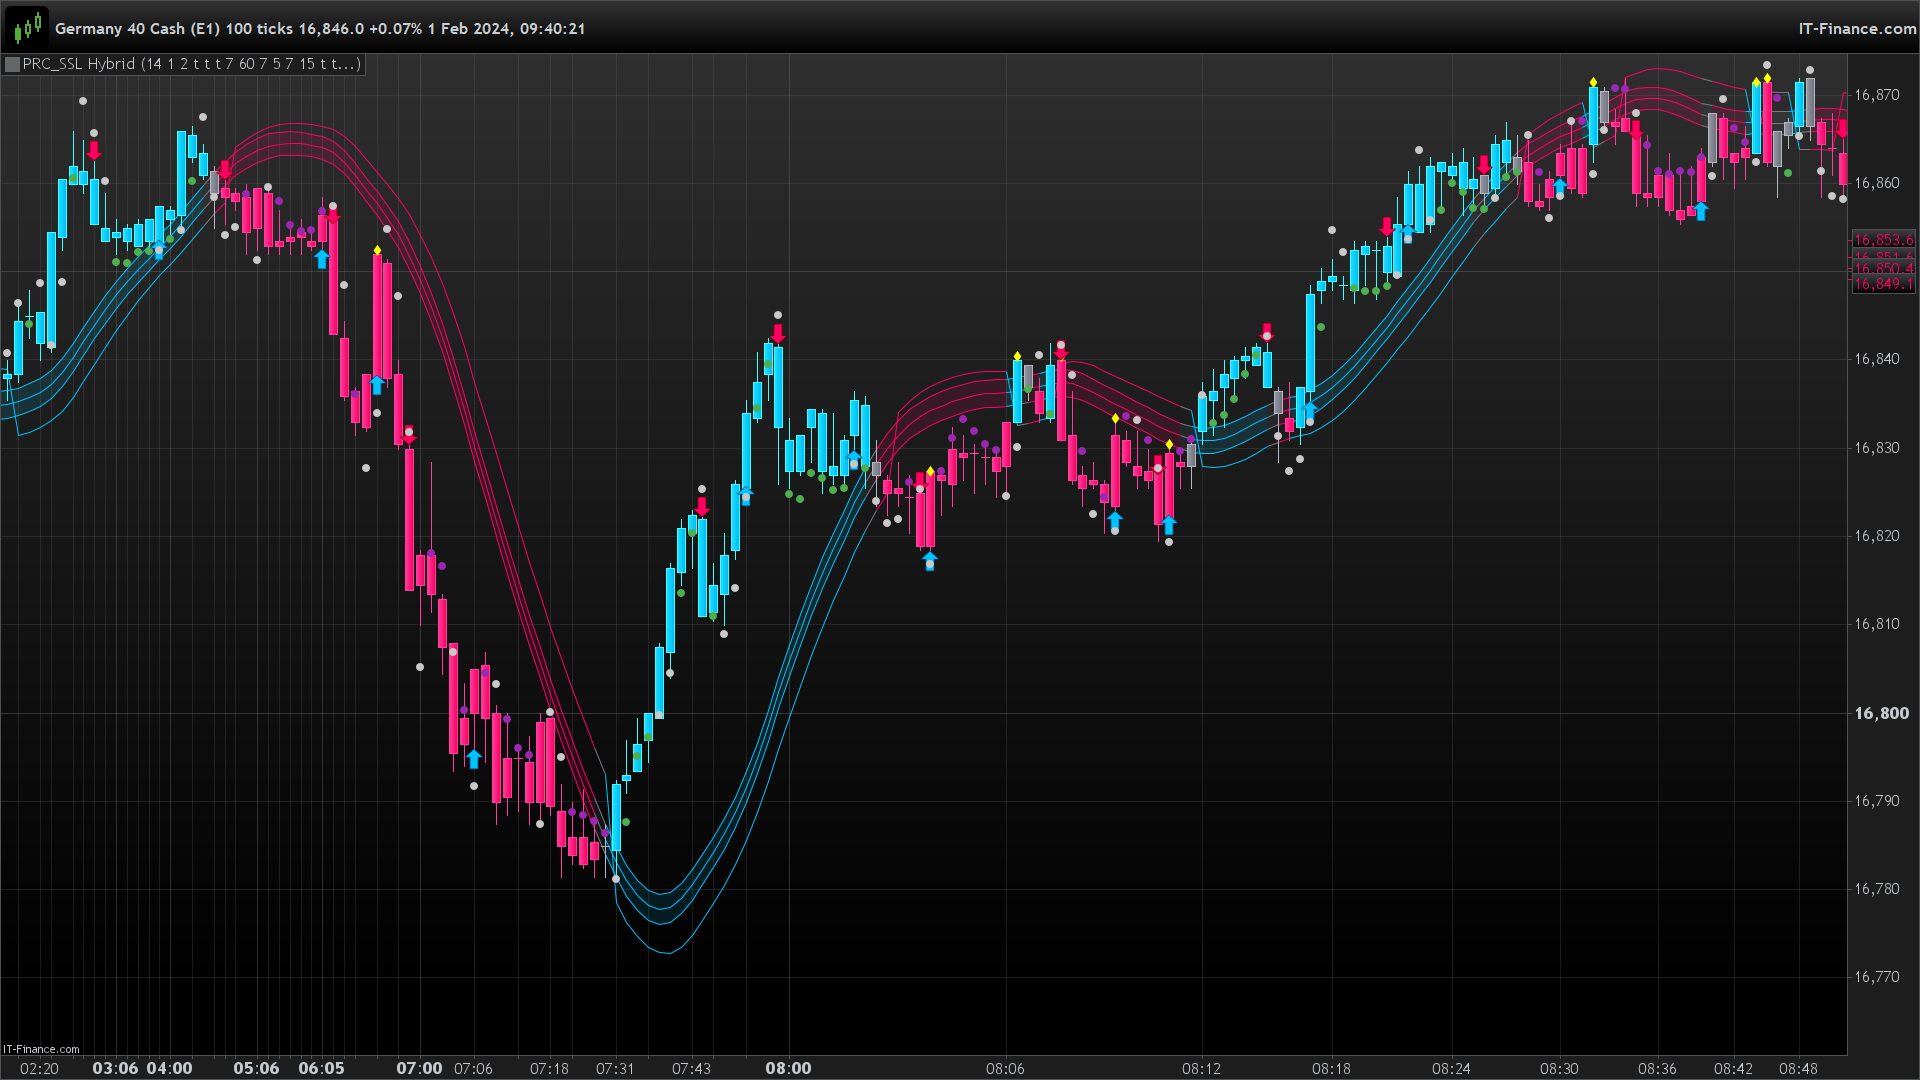
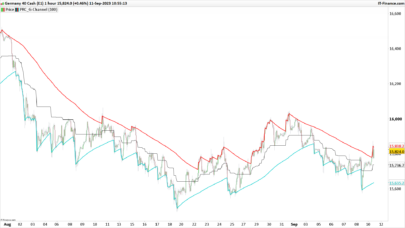
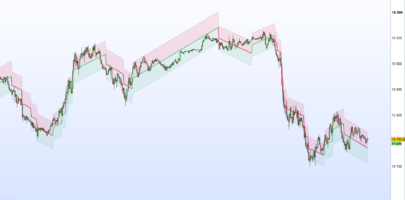
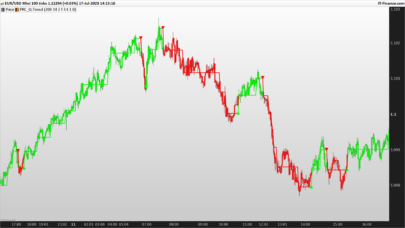
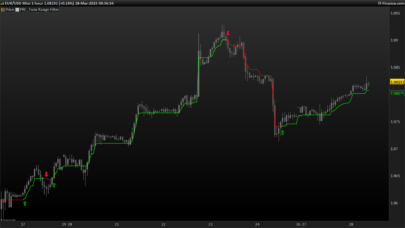
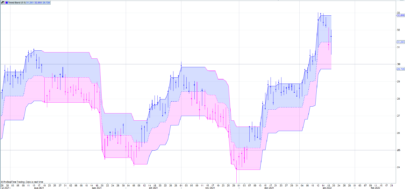
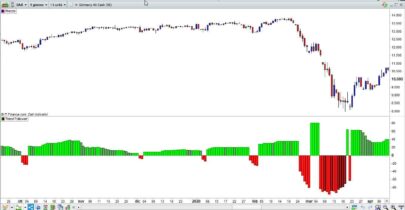
SSL stands for semaphore signal level, typically used as a channel for trend trading, but here SSL1 acts as the trend detection aspect of the indicator and is referred to as the baseline. It has three lines, and when these lines are pink, the trend is bearish, and when blue, bullish. If the lines happen to turn gray, this is because the price is interacting with the baseline, and this can be an early indication that the trend is about to change.
There are several options available for how this baseline is calculated.
SSL2
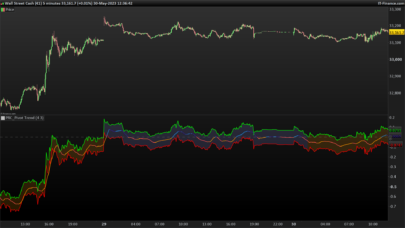
In this case, the SSL combines the price position with respect to moving averages channel and ATR channel. As in the SSL1 there are several options available for how this indicator is calculated.
SSL3 (EXIT trades)
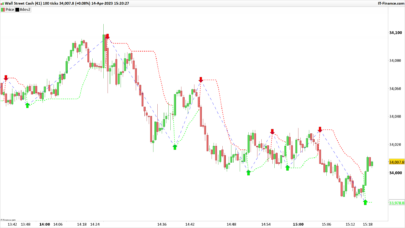
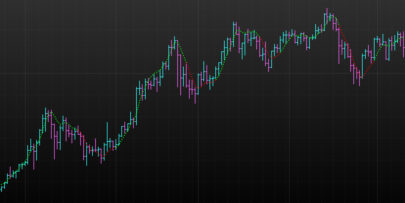
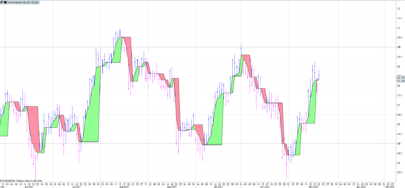
The arrows are buy and sell labels, and these are independent of the baseline, meaning if the baseline shows a bearish trend, you might still receive bullish signals, and if the baseline is bullish, you will still receive bearish signals. This is because they can also be used as exit signals depending on how you are trading with the indicator.
Aditional ATR lines
We have also ATR bands with the SSL Hybrid indicator. ATR stands for average true range, and it calculates the volatility in the market and shows us the average area prices likely to fluctuate within. This is great because it allows us to see what is the current volatility of the market, and we can set stops at areas that price is unlikely to reach.
Original description from author (Mihkel00)
This script is designed for the NNFX Method, so it is recommended for Daily charts only.
Tried to implement a few VP NNFX Rules.
This script has a SSL / Baseline (you can choose between the SSL or MA), a secondary SSL for continuation trades and a third SSL for exit trades.
Alerts added for Baseline entries, SSL2 continuations, Exits.
Baseline has a Keltner Channel setting for “in zone” Gray Candles.
Added “Candle Size > 1 ATR” Diamonds from my old script with the criteria of being within Baseline ATR range.
SSL Hybrid indicator ProRealtime code
Below I’ll leave the code so you can copy and paste it into your probuilder.
|
1 2 3 4 5 6 7 8 9 10 11 12 13 14 15 16 17 18 19 20 21 22 23 24 25 26 27 28 29 30 31 32 33 34 35 36 37 38 39 40 41 42 43 44 45 46 47 48 49 50 51 52 53 54 55 56 57 58 59 60 61 62 63 64 65 66 67 68 69 70 71 72 73 74 75 76 77 78 79 80 81 82 83 84 85 86 87 88 89 90 91 92 93 94 95 96 97 98 99 100 101 102 103 104 105 106 107 108 109 110 111 112 113 114 115 116 117 118 119 120 121 122 123 124 125 126 127 128 129 130 131 132 133 134 135 136 137 138 139 140 141 142 143 144 145 146 147 148 149 150 151 152 153 154 155 156 157 158 159 160 161 162 163 164 165 166 167 168 169 170 171 172 173 174 175 176 177 178 179 180 181 182 183 184 185 186 187 188 189 190 191 192 193 194 195 196 197 198 199 200 201 202 203 204 205 206 207 |
//PRC_SSL Hybrid | indicator //version = 0 //31.01.24 //Iván González @ www.prorealcode.com //Sharing ProRealTime knowledge ///////////////DEFAULT PARAMETERS////////////////////////////////////// atrlen = 14 mult = 1.0 smoothing=2 //(Average type. Default WMA) showcandleviolation=1 //(Boolean) showcolor=1 //(Boolean) showSSL2=1 //(Boolean) ssl1Type = 7 //(Average type. Default HMA) len = 60 ssl2Type = 7 //(Average type. Default HMA) len2 = 5 //(Integer) Exittype = 7 //(Average type. Default HMA) len3 = 15 //(Integer) showbaseline = 1 //(Boolean) baselinetype = 7 //(Average type. Default HMA) Usetruerange = 1 //(Boolean) multy = 0.2 //(Decimal) ////////////////////////////////////////////////////////////////// //atr atrlensmoot = average[atrlen,smoothing](TR(close)) //atr up/low bands upperband = atrlensmoot * mult + close lowerband = close - atrlensmoot * mult ////Ssl 1 emahigh = average[len,ssl1Type](high) emalow = average[len,ssl1Type](low) ////Ssl 2 mahigh = average[len2,ssl2Type](high) malow = average[len2,ssl2Type](low) ////Exit src = CustomClose exithigh = average[len3,ExitType](high) exitlow = average[len3,ExitType](low) ////keltner baseline channel bbmc = average[len,baselineType](close) keltma = average[len,baselineType](src) if UseTrueRange then myrange = tr else myrange = high-low endif rangema = exponentialaverage[len](myrange) upperk = keltma + rangema * multy lowerk = keltma - rangema * multy ////baseline violation candle openpos = open*1 closepos = close*1 difference = abs(closepos-openpos) atrviolation = difference > atrlensmoot inrange = upperband > bbmc and lowerband < bbmc candlesizeviolation = atrviolation and inrange //Ssl1 values if close > emahigh then hlv = 1 elsif close < emalow then hlv = -1 else hlv = hlv[1] endif if Hlv < 0 then ssldown = emahigh else ssldown = emalow endif //Ssl2 values if close > mahigh then hlv2 = 1 elsif close < malow then hlv2 = -1 else hlv2 = hlv[1] endif if hlv2 < 0 then ssldown2 = mahigh else ssldown2 = malow endif //Exit values if close > exithigh then hlv3 = 1 elsif close < exitlow then hlv3 = -1 else hlv3 = hlv3[1] endif if hlv3 < 0 then sslexit = exithigh else sslexit = exitlow endif basecrosslong = close crosses over sslexit basecrossshort = sslexit crosses over close if basecrosslong then codiff = 1 elsif basecrossshort then codiff = -1 else codiff = 0 endif //////////Colours////////////////////////////// ///Bars if close > upperk then rbar= 0 gbar= 195 bbar= 255 elsif close < lowerk then rbar=255 gbar=0 bbar=98 else rbar=120 gbar=123 bbar=134 endif //Ssl1 if close > ssldown then rssl1= 0 gssl1= 195 bssl1= 255 elsif close < ssldown then rssl1= 255 gssl1= 0 bssl1= 98 endif //Exit if codiff > 0 then rcodiff=0 gcodiff=195 bcodiff=255 elsif codiff < 0 then rcodiff=255 gcodiff=0 bcodiff=98 endif /////////SSL2 continuation from ATR////////////// atrcrit =0.9 upperhalf = atrlensmoot * atrcrit + close lowerhalf = close - atrlensmoot * atrcrit buyinatr = lowerhalf < ssldown2 buycont = close > bbmc and close > ssldown2 sellinatr = upperhalf > ssldown2 sellcont = close < bbmc and close < ssldown2 buyatr = buyinatr and buycont sellatr = sellinatr and sellcont //Points colour if buyatr then rpto = 76 gpto = 175 bpto = 80 elsif sellatr then rpto = 156 gpto = 39 bpto = 176 else rpto = 200 gpto = 200 bpto = 200 endif ///////////////////Plots//////////////////////////// //plotshape --> candlesizeviolation if showcandleviolation and candlesizeviolation then drawtext("♦",barindex,high)coloured(255,255,0) endif //color bars if showcolor then DRAWCANDLE(open, high, low, close) coloured(rbar,gbar,bbar) endif //Exit Arrows if codiff > 0 then drawarrowup(barindex,low-0.1*atrlensmoot)coloured(rcodiff,gcodiff,bcodiff) elsif codiff < 0 then drawarrowdown(barindex,high+0.1*atrlensmoot)coloured(rcodiff,gcodiff,bcodiff) endif //Ssl2 if showSSL2 then drawpoint(barindex,ssldown2,2)coloured(rpto,gpto,bpto) endif //color BASELINE channel if showbaseline then ColorBetween(lowerk,upperk,rbar,gbar,bbar,30) endif return showbaseline*bbmc as "baseline" coloured(rbar,gbar,bbar),showbaseline*upperk as "up line" coloured(rbar,gbar,bbar), showbaseline*lowerk as "low line" coloured(rbar,gbar,bbar),ssldown as "SSL1" coloured(rbar,gbar,bbar), upperband as "+ATR", lowerband as "-ATR" |
Share this
No information on this site is investment advice or a solicitation to buy or sell any financial instrument. Past performance is not indicative of future results. Trading may expose you to risk of loss greater than your deposits and is only suitable for experienced investors who have sufficient financial means to bear such risk.
ProRealTime ITF files and other attachments :
Find other exclusive trading pro-tools on ![]()
PRC is also on YouTube, subscribe to our channel for exclusive content and tutorials


Hello Ivan,
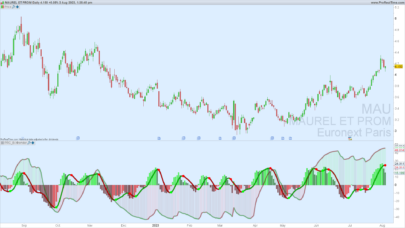
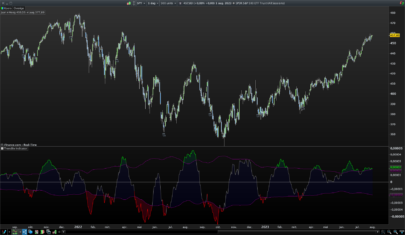
Would it be possible to convert the code of this QQE MOD indicator which accompanies SSL HYBRID?
Hi,
Yes I can translate it but please, create a new topic for it.
here is the code:
//@version=4
//By Glaz, Modified
//
study(“QQE MOD”)
RSI_Period = input(6, title=’RSI Length’)
SF = input(5, title=’RSI Smoothing’)
QQE = input(3, title=’Fast QQE Factor’)
ThreshHold = input(3, title=”Thresh-hold”)
//
src = input(close, title=”RSI Source”)
//
//
Wilders_Period = RSI_Period * 2 – 1
Rsi = rsi(src, RSI_Period)
RsiMa = ema(Rsi, SF)
AtrRsi = abs(RsiMa[1] – RsiMa)
MaAtrRsi = ema(AtrRsi, Wilders_Period)
dar = ema(MaAtrRsi, Wilders_Period) * QQE
longband = 0.0
shortband = 0.0
trend = 0
DeltaFastAtrRsi = dar
RSIndex = RsiMa
newshortband = RSIndex + DeltaFastAtrRsi
newlongband = RSIndex – DeltaFastAtrRsi
longband := RSIndex[1] > longband[1] and RSIndex > longband[1] ?
max(longband[1], newlongband) : newlongband
shortband := RSIndex[1] < shortband[1] and RSIndex upper ? #00c3ff : RsiMa – 50 = 50 ? QQEzlong + 1 : 0
QQEzshort := RSIndex longband2[1] and RSIndex2 > longband2[1] ?
max(longband2[1], newlongband2) : newlongband2
shortband2 := RSIndex2[1] < shortband2[1] and RSIndex2 = 50 ? QQE2zlong + 1 : 0
QQE2zshort := RSIndex2 ThreshHold2 ? color.silver :
RsiMa2 – 50 ThreshHold2
Greenbar2 = RsiMa – 50 > upper
Redbar1 = RsiMa2 – 50 < 0 – ThreshHold2
Redbar2 = RsiMa – 50 < lower
plot(Greenbar1 and Greenbar2 == 1 ? RsiMa2 – 50 : na, title="QQE Up", style=plot.style_columns, color=#00c3ff, transp=0)
plot(Redbar1 and Redbar2 == 1 ? RsiMa2 – 50 : na, title="QQE Down", style=plot.style_columns, color=#ff0062, transp=0)