




More from ProRealCode
ProRealCode - Trading & Coding with ProRealTime™
The ProRealTime™ community on the web! Officially sharing ProRealTime knowledge to Worldwide users since 2015!



Trend Indicator based on the range of the price
January 4, 2022, 9:06 AM
Indicators
2 Comments
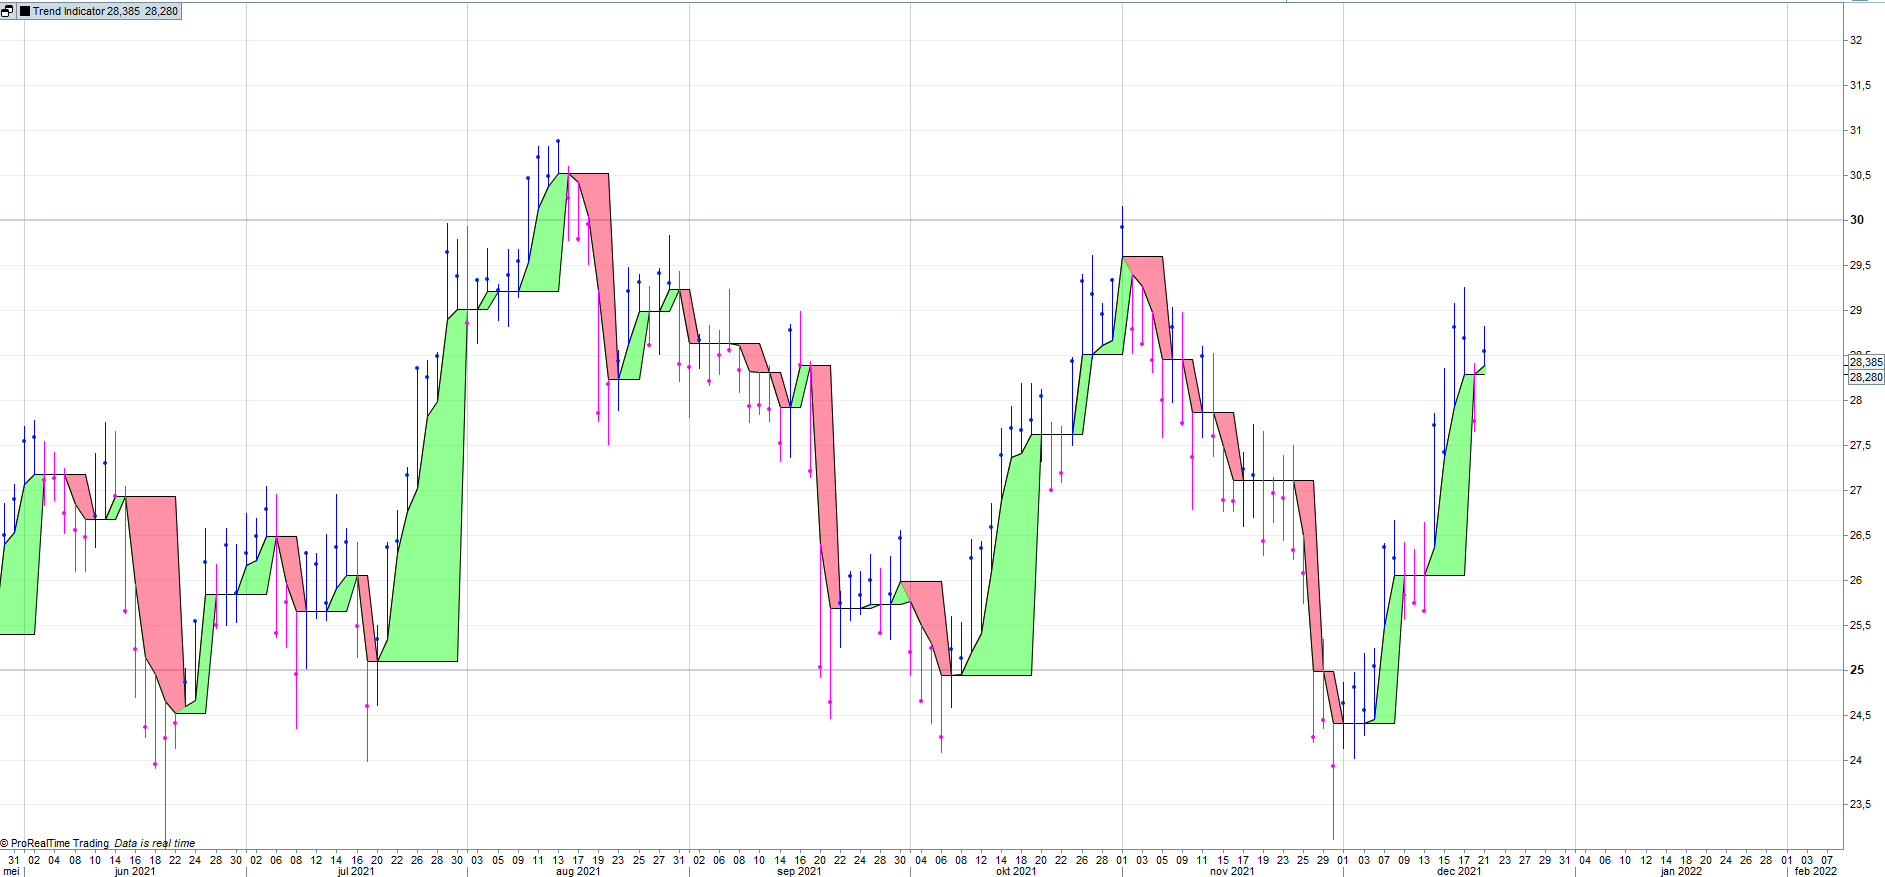
This indicator is based on the range of the price movements and the colored areas might help you to easy identify the trend of the price.
// This indicator is based on the range of price movements and the colored areas might help you
// to easy identify thr trend of the price

ONCE AFR = Close
ONCE i = 0
ONCE j = 0

IF High < AFR  THEN
AFR = high
ENDIF

IF Low > AFR THEN
AFR = low
ENDIF

IF Close > AFR THEN
DRAWPOINT(barindex, close, 1)coloured(0,51,255)
DRAWSEGMENT(barindex, high, barindex, low)coloured(0,0,255)
ELSE
DRAWPOINT(barindex, Close, 1)coloured(251,0,255)
DRAWSEGMENT(barindex, high, barindex, low)coloured(255,0,255)
ENDIF

IF AFR < AFR[1] THEN
i = i + 1
AFR2 = AFR[i]
ELSE
i = 0
AFR2 = AFR
ENDIF

IF AFR > AFR[1] THEN
j = j + 1
AFR3 = AFR3[i]
ELSE
j = 0
AFR3 = AFR
ENDIF

RETURN AFR, AFR2, AFR3
Download
Filename:
Trend-Indicator-based-on-range.itf
Downloads:
206
Average
This author is like an anonymous function, present but not directly identifiable. More details on this code architect as soon as they exit 'incognito' mode.
Author’s Profile
Similar code
Trend Following Bars (heatmap)Indicators
Trend Following Moving AveragesIndicators
Trend & Range // Indicator & ScreenerIndicators
Twin Range FilterIndicators
Flat TrendIndicators
Trendfollower EUR/USD 5MStrategies
Comments
You must be logged in to post a comment.
Hi Stenozar, You need to add the color zones yourself , just go to Add Color Zone To set use for ,,,line 1 : range and for ,,,line 2 : range2 . Add the second color zone: Use for ,,,line 1 : range and for ,,, line 2 : range3. In the first lines block you choose: Line 1 Line 2 Hope you get it!
Loading...
Hi Sever, how can I visualize the coloured areas?