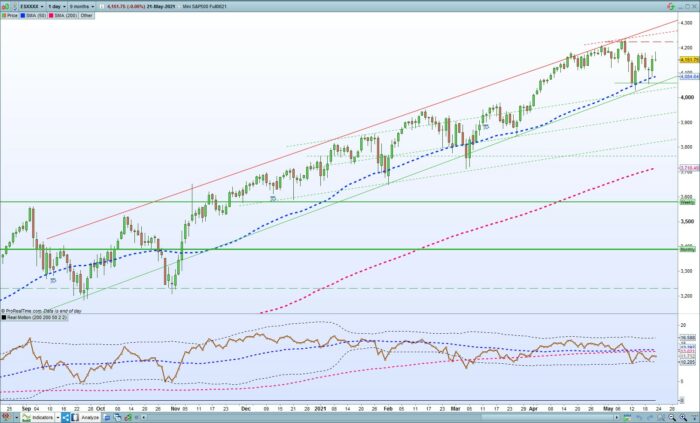
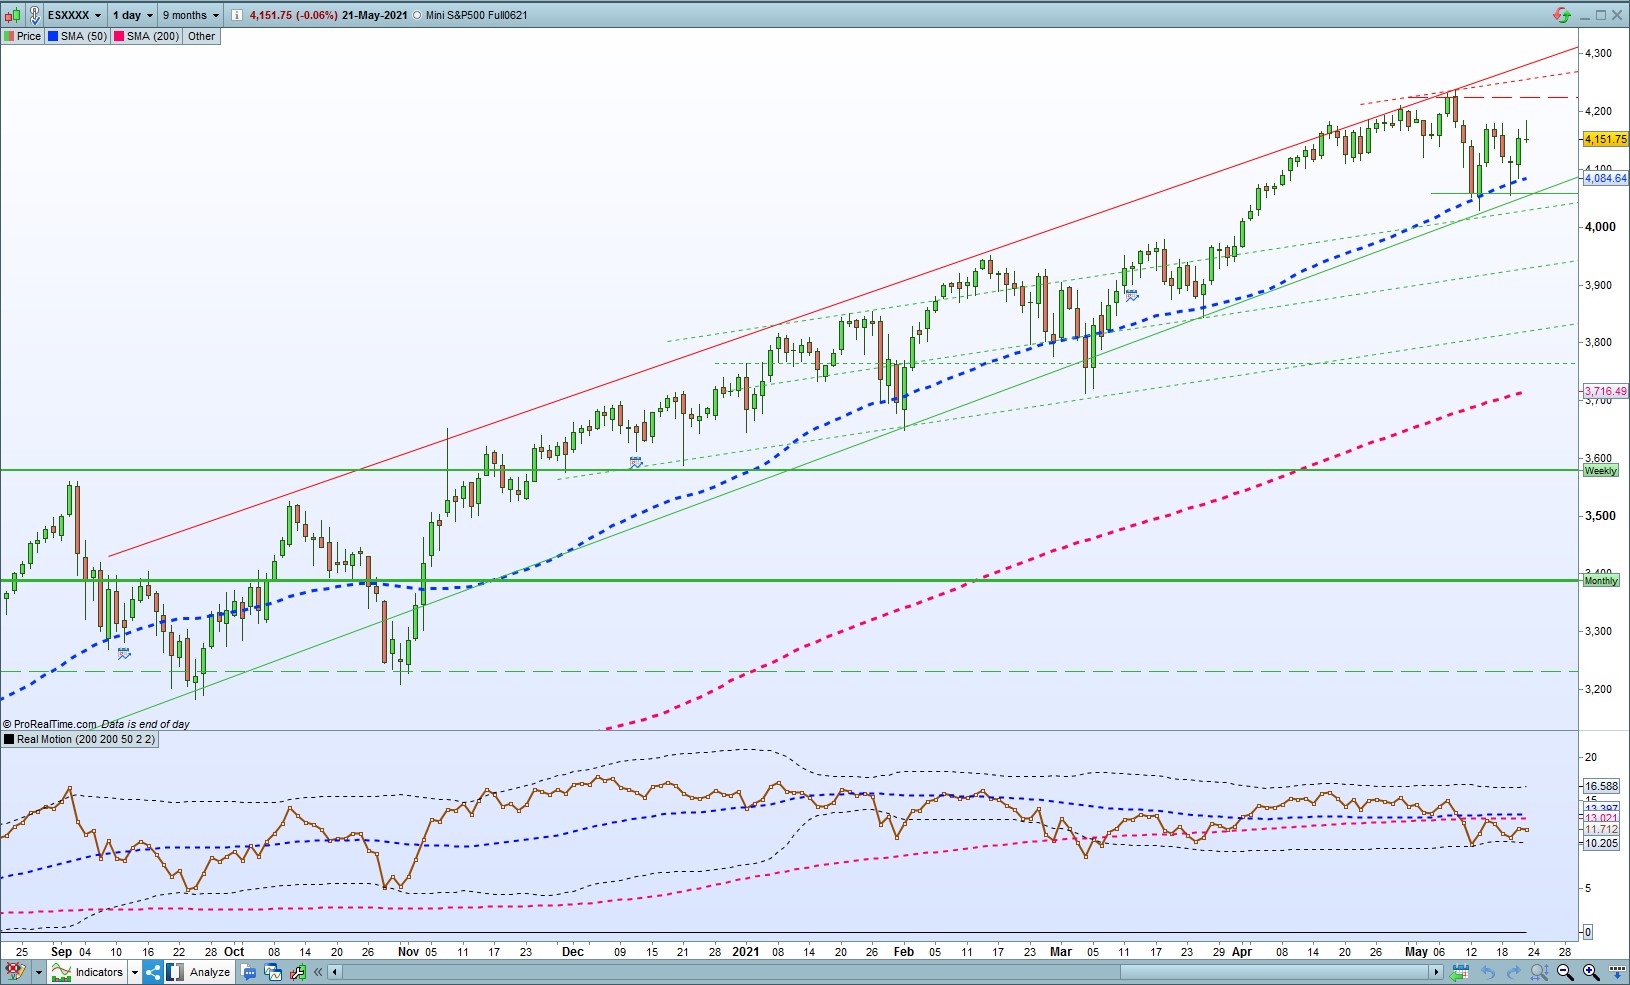
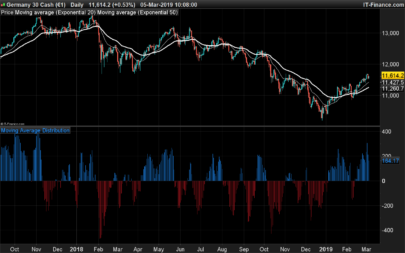
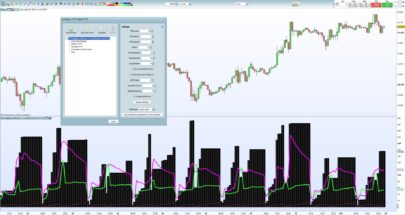
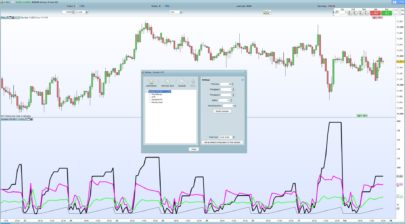
RealMotion indicator as explained by Market Gauge
“The brown dots are a dot plot of the individual values of the RealMotion variable. Essentially, they divide the equity price by the moving average of that price (here 200 period). We then subtract one and multiply that value by 100. This centers the indicator at zero (when price = moving average then RealMotion will equal zero). Furthermore, by multiplying by 100 we make it so that when RealMotion = 5.0 we can say that the price is 5% greater than the reference moving average.”
|
1 2 3 4 5 6 7 8 9 10 11 12 13 14 15 16 17 18 19 20 21 22 23 24 25 26 27 28 29 30 31 32 |
// Real Motion indicator (a Market Gauge indicator) //ported to Prorealtime by ciccio // //Default Values: //PrimaryAverage=200 //RealMotionAverageSlow=200 //RealMotionAverageFast=50 //NumDevsUp=2 //NumDevsDn=2 // //BaseLine represents 200 days SMA of price closes BaseLine=0 //RealMotion indicator as explained by Market Gauge //"The brown dots are a dot plot of the individual values of the RealMotion variable. //Essentially, they divide the equity price by the moving average of that price (here 200 period). //We then subtract one and multiply that value by 100. //This centers the indicator at zero (when price = moving average then RealMotion will equal zero). //Furthermore, by multiplying by 100 we make it so that when RealMotion = 5.0 //we can say that the price is 5% greater than the reference moving average." PrimaryAveragePlot=Average[PrimaryAverage](close) RealMotion=(close/PrimaryAveragePlot - 1)*100 SlowRealMotion=Average[RealMotionAverageSlow](RealMotion) FastRealMotion=Average[RealMotionAverageFast](RealMotion) //Bollinger Bands fUpperBand = FastRealMotion + ((STD[RealMotionAverageFast](RealMotion)) * NumDevsUp) fLowerBand = FastRealMotion - ((STD[RealMotionAverageFast](RealMotion)) * NumDevsDn) //Plotting Return RealMotion COLOURED(150,75,0) AS "Real Motion", SlowRealMotion COLOURED(255,0,102) AS "SlowRealMotion", FastRealMotion COLOURED(0,0,255) AS "FastRealMotion", fLowerBand COLOURED(0,0,0) AS "fLowerBand", fUpperBand COLOURED(0,0,0) AS "fUpperBand", BaseLine COLOURED(0,0,0) AS "BaseLine" |
Share this
No information on this site is investment advice or a solicitation to buy or sell any financial instrument. Past performance is not indicative of future results. Trading may expose you to risk of loss greater than your deposits and is only suitable for experienced investors who have sufficient financial means to bear such risk.
ProRealTime ITF files and other attachments :
Find other exclusive trading pro-tools on ![]()
PRC is also on YouTube, subscribe to our channel for exclusive content and tutorials


Sarebbe utile avere qualche indicazione di massima sull’utilizzo di questo indicatore (la sua funzione fondamentale, gli eccessi e via discorrendo), grazie
Hi Luxrun
http://www.marketgauge.com/wp-content/uploads/2016/04/MG-Real-Motion-Indicator-Description.pdf
Thanks
@luxrun
Read the pdf file
Thanks for the indication of the pdf. I’m actually looking for something more practical with examples of price analysis and the different behaviors of the indicator. On google I found this first video that I suggest to learn the characteristics of the indicator and other different settings. Thanks again, here is the link:
https://www.youtube.com/watch?v=Yow4P1hTfbY&ab_channel=StockCharts