Murray math levels

Murray math levels

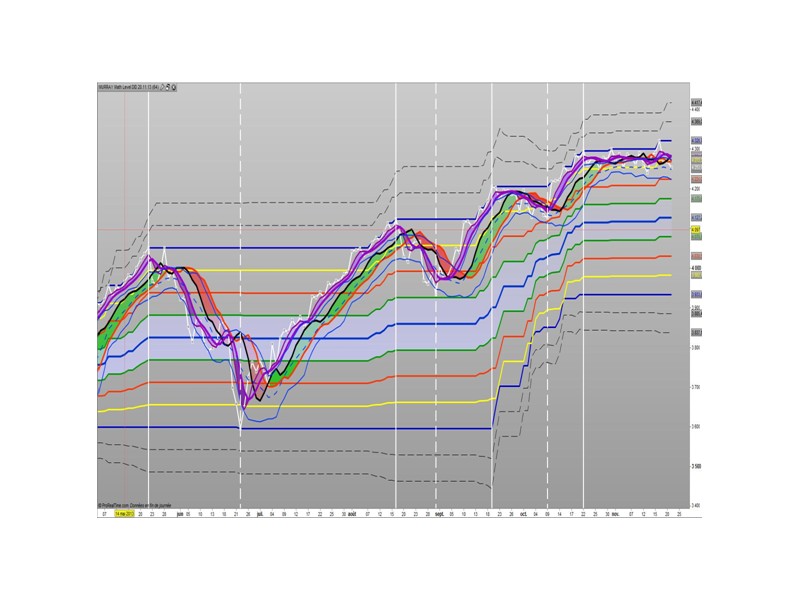
The Murrey Math lines levels are determined within some principles of Gann levels and candlesticks formations. The Murrey Math levels act pretty much like pivot and support/resistance areas.

1. Line 8/8 – 0/8 (Ultimate Support and Ultimate Resistance).
Those lines are the most strong concerning Support and resistance.

2. Line 7/8 (Weak, Place to Stop and Reverse).
This line is weak. If suddenly the price was going too fast and too far and stops around this line it means the price will reverse down very soon. If the price did not stop near this line this price will continue the movement to the line 8/8.
3. Line 1/8 (Weak, Place to Stop and Reverse).
This line is weak. If suddenly the price was going too fast and too far and stops around this line it means the price will reverse up very soon. If the price did not stop near this line this price will continue the movement down to the line 0/8.

4. Line 2/8 and 6/8 (Pivot, Reverse)
Those two lines yield the line 4/8 only to the strength to reverse the price movement.

5. Line 5/8 (Top of Trading Range)
The price is spending the about 40% of the time on the movement between the lines 5/8 and 3/8. If the price is moving near line 5/8 and stopping near the line during the 10 – 12 days so it means that it is necessary to sell in this “bonus zone” (some people are doing like this) but if the price is keeping the tendency to stay above 5/8 line, so it means that the price will be above. But if the price is droping below 5/8 line it means that the price will continue falling to the next level of resistance.

6. Line 3/8 (Bottom of Trading Range).
If the price is below this line and in uptrend it means that it will be very difficult for the price to break this level. If the price broke this line during the uptrend and staying above during the 10- 12 days it means that the price will be above this line during the 40% of its time moving between this line and 5/8 line.

7. Line 4/8 (Major Support/Resistance Line).
It is the major line concerning support and resistance. This level is the better for the new sell or buy. It is the strong level of support of the price is above 4/8. It is the fine resistance line if the price is below this 4/8 line.


Share this

Risk disclosure:

No information on this site is investment advice or a solicitation to buy or sell any financial instrument. Past performance is not indicative of future results. Trading may expose you to risk of loss greater than your deposits and is only suitable for experienced investors who have sufficient financial means to bear such risk.

ProRealTime ITF files and other attachments : How to import ITF files into ProRealTime platform?

PRC is also on YouTube, subscribe to our channel for exclusive content and tutorials
  1. MonopolyTm • 10/04/2016 #

    Hello, Do you think it is possible to code something similar to the example in the following link?
    https://www.fxstreet.com/analysis/murray-math-analysis-gbp-usd-eur-cad-201707211405

  2. robertogozzi • 10/04/2016 #

    Why HAUT and BAS have been calculated AFTER line 8?
    Shouldn’t they be calculated BEFORE line 6?

avatar
Register or

Likes

avatar avatar avatar avatar avatar avatar avatar avatar avatar
Related users ' posts
Nicolas You need to have enough bars loaded on your chart for the indicator to compute completely th...
verdi55 Working with separately calculated supertrend indicators in backtests is usually somewhat pr...
Nicolas Very interesting Verdi. Would be a great addition to the library, your own modified version ...
tatankayotanka
9 years ago
T3 Velocity mix
T3 Velocity mix
4
Indicators
Maximus Hello, I have not found better tool for analyzing divergences. Congrats !
tatankayotanka Ciao , tu come lo usi?
Fabius965 Ciao tatankayotanka.....ho provato a caricare il tuo indicatore ciclico, ma quando chiedo la...
Rohan
9 years ago
gabri Great job!! I love everything that involve Ichimoku. Did you think about changing the line t...
Rohan Thanx gabri. Yes I did play around with the offset. It works but I like the "earlier" warnin...
Dom Dominics Hi, Is this code can be used for MT4 ?
Nicolas
9 years ago
Haos Visual
Haos Visual
8
Indicators
Lyny @Nicolas, how can i put this code in ProOder when for example i want to buy 1 share with con...
Nicolas Please open a new topic on forums for coding requests, I'll help you there. 
Johan Swarts Lyny / Nicolas Please advise whether you proceded with the code in ProOrder and if so where...
gabri Ichimoku is one of the best trend indicator ever together with the Guppy EMA's. I agree with...
primo1 thanks
traderkarnik Rohan, Have you tried encorporating momentum indicator? if waiting for future cross in your...
Bard Thanks for posting this indicator @Nicolas, I'm wondering if it's possible to have a % ROC s...
Nicolas Hi Bard, angle of a MA is nothing more than a ROC oscillation. I assume, that's why you foun...
bolsatrilera
9 years ago
Twiggs Money Flow
Twiggs Money Flow
6
Indicators
Nicolas https://www.prorealcode.com/documentation/average/ 0 = SMA 1 = EMA 2 = WMA 3 = Wilder 4 = Tr...
century thanks alot . it's all i need ;)
dcos Any ideas why this would return an empty chart? Imported the ITF and it doesn't seem to want...
Nicolas
9 years ago
Jurik MACD
Jurik MACD
1
Indicators
ramonjp Hi Nicolas, this sentence is correct?? ftmp0 = (1-falpha)*price + falpha*tmp0[1] I thi...
Nicolas
9 years ago
Gann HiLo activator
Gann HiLo activator
3
Indicators
maxxb salve,  vorrei sapere perchè nel suo grafico compare sul prezzo mentre a me compare a parte...
AleX Sul grafico principale accanto alla voce Prezzo (vedi in alto a sinistra proprio sotto l'are...
maxxb perfetto non lo sapevo ....  ciao grazie..     
Nicolas
9 years ago
Holt EMA
Holt EMA
1
Indicators
robertanthonyuk Hi,What do the each colour represent? Rob
bolsatrilera
9 years ago
MACD MIRROR
MACD MIRROR
0
Indicators
Pere
9 years ago
Nicolas
9 years ago
StepRSI
StepRSI
5
Indicators
Nicolas Thanks for this modification, I still do not have tested it, where did you get this idea to ...
rfsteve Trial and error from study of indicators call it coding mad science was trying to find an in...
Maxime Baudin Nice! Thanks :)
bolsatrilera
9 years ago
Volume climate
Volume climate
0
Indicators
Nicolas Je vais faire l'indicateur et expliquer comment en même temps dans un sujet de forum. Plus s...
gregus merci nicolas toute ma gratitude est pour toi sa sera bien pratique car je pense ne pas etre...
Nicolas Ok merci donc d'ouvrir un sujet spécifique pour cette demande donc :) 
Nicolas
9 years ago
Signal to noise ratio
9
Indicators
robcole Hello Nicolas, I found this indicator by a google search. since I am mt4 user and you wro...
Nicolas Hi Rob, sorry I do not offer MT4 support and I coded this one months ago, I think you'll hav...
robcole Thx for your reply, i understand, my hope was that you stillhave the mt4 version... however,...
Nicolas You'll need to preload bars to get the good calculations of you indicators. I did not test i...
David Nicolas I tried DEFPARAM Preloadbars = 5000 And still the same drawn output of entries/exit...
marcara Hi, Thank you very much for the Moving Average Daily indicator, I am using it as indicator i...
algotrader This indicator looks coolBut on attempt to use it for a strategy dev'I get an error.."The in...
dajvop @algotrader if you at the bottom of the code add: RETURN Buffer1 as "up", Buffer2 as "down",...
Bateson Si cela peut servir, l'indicateur Sadukey a été créé en utilisant un générateur de filtre ap...
Nicolas Je l'ai converti depuis un code pinescript. De mémoire il s'agit bien d'une variation d'une ...
Captain_Walker @Nicolas, I've copied your code into PRT indicator panel to create it. When I attempt to sav...
Nicolas Download the itf file and import it.

Top