Second version of this indicator, first one can be found here: http://www.prorealcode.com/prorealtime-indicators/fractals-zigzag/
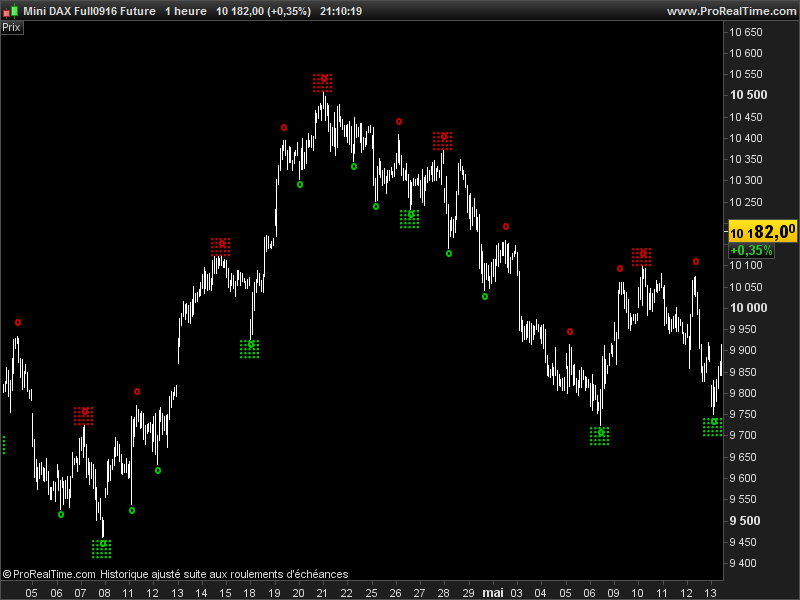
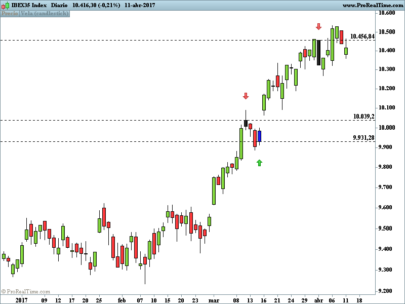
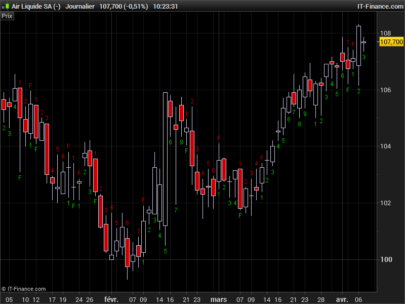
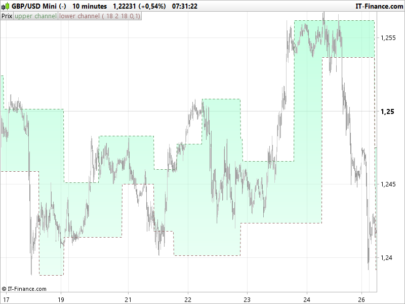
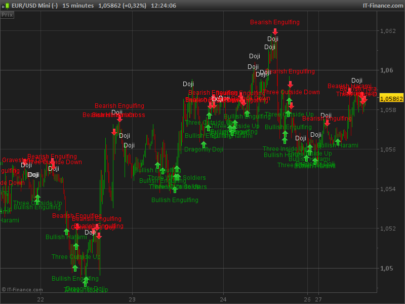
This new version draw only High/Low points of the fractals zigzag on chart. It draws major points (green and red squares) which are calculated with a lookback of 20 periods by default (“cp” parameter can be changed at will).
The minor points (green and red dots) are calculated the same way but with the default period divided by 2 (so 20/2=10 periods by default).
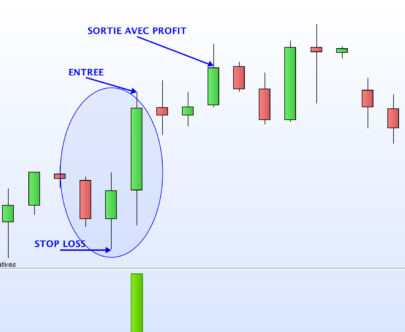
This indicator can be used to trade 123 pattern of any other kind of breakout strategies.
|
1 2 3 4 5 6 7 8 9 10 11 12 13 14 15 16 17 18 19 20 21 22 23 24 25 26 27 28 29 30 31 32 33 34 35 36 37 38 39 40 41 42 43 44 45 46 47 48 49 50 51 52 53 54 55 56 57 58 59 60 61 62 63 64 65 66 67 68 69 |
//---external parameters //cp = 20 once lastpoint = 0 ATR = averagetruerange[cp] //---major zigzag points if high[cp] >= highest[2*cp+1](high) then LH = 1 else LH = 0 endif if low[cp] <= lowest[2*cp+1](low) then LL = -1 else LL = 0 endif if LH = 1 then TOPy = high[cp] TOPx = barindex[cp] endif if LL = -1 then BOTy = low[cp] BOTx = barindex[cp] endif if LH>0 and (lastpoint=-1 or lastpoint=0) then DRAWTEXT("░",TOPx,TOPy+ATR/2,Dialog,Bold,20) coloured(200,0,0,255) lastpoint = 1 endif if LL<0 and (lastpoint=1 or lastpoint=0) then DRAWTEXT("░",BOTx,BOTy-ATR/2,Dialog,Bold,20) coloured(0,200,0,255) lastpoint = -1 endif //---mino zigzag points if high[round(cp/2)] >= highest[cp+1](high) then LLH = 1 else LLH = 0 endif if low[round(cp/2)] <= lowest[cp+1](low) then LLL = -1 else LLL = 0 endif if LLH = 1 then LTOPy = high[round(cp/2)] LTOPx = barindex[round(cp/2)] endif if LLL = -1 then LBOTy = low[round(cp/2)] LBOTx = barindex[round(cp/2)] endif if LLH>0 then DRAWTEXT("º",LTOPx,LTOPy+ATR/2,Dialog,Bold,20) coloured(200,0,0,255) endif if LLL<0 then DRAWTEXT("º",LBOTx,LBOTy-ATR/2,Dialog,Bold,20) coloured(0,200,0,255) endif RETURN |
Share this
No information on this site is investment advice or a solicitation to buy or sell any financial instrument. Past performance is not indicative of future results. Trading may expose you to risk of loss greater than your deposits and is only suitable for experienced investors who have sufficient financial means to bear such risk.
ProRealTime ITF files and other attachments :
Find other exclusive trading pro-tools on ![]()
PRC is also on YouTube, subscribe to our channel for exclusive content and tutorials


Bonjour Nicolas
Quand je veux changer la valeur de CP : l’indicateur plante ! je suis tout seul dans ce cas ?
Dear Nicolas,
I receive the following message:
Fehler im Indikator: PRC_MultiFractalsZigZag (20)Syntax-Fehler: Linie 31, Zeichen 9Eines der folgenden Zeichen eignet sich besser als “(“:– “,”– “=”
Any ideas?
Thanks and kind regards,
Michael
This code is only compatible with version 10.3 of the platform.
enfin IG as mis la version 10.3 alleluia!
Le changement de la variable CP plante toujours ! il n’y a que moi dans ce cas ? merci de me donner vos retours
bonne journée
Avec quelle valeur ?
Air liquide par exemple, je travaille avec tout le SRD et c’est pareil pour tout.
j’ai rajouté dans le code : cc = customclose
d’autre part impossible de remonter une image du message d’erreur dans ce post !? ( vous n’avez pas l’autorisation )
Ok je vais chercher pourquoi, je n’ai pas eu le problème. C’est peut-être un problème d’arrondi à ajouter au calcul des points intermédiaires.
Salut Nicolas
Est-ce basé sur repaints indicateur zigzag ?
Bonjour, cet indicateur ne repeint pas. Les Zig et Zag se tracent à la détection des nouveaux fractals.
Non c’è nessuna possibilità per il Fractal zig zag di farlo vedere anche sulla versione 10.2 ?
Salut Nicolas,
my broker IG told me, that they will not upgrade to 10.3 for a long periodsince they have implemented 10.2 just this year.
Is there any chance to downgrade this code to 10.2 (guess many user here trade with IG)?
At least this piece of code?
I receive the following message:
Fehler im Indikator: PRC_MultiFractalsZigZag (20)Syntax-Fehler: Linie 31, Zeichen 9Eines der folgenden Zeichen eignet sich besser als “(“:– “,”– “=”
Many thanks in advance.
Kind regards,
Michael
Hi Traderfox06, sorry but the results with v10.2 would not be the same all, visually. The last fractals zig-zag would be shown on the current candlestick and not well placed on the higher high and lower low in the past (left part of the chart). Of course, if you don’t need it to be visually accurate on what candlesticks appeared the fractals, the returned values are still correct and could be interpreted by an automated trading strategy for instance.
Bonjour Nicolas
Il plante chez moi également si je change la valeur cp et parfois même sans. Je parle bien sur en version 10 3
Pourra t on l’utiliser dans une stratégie??
Bonne journée
Madrosat
Je pense qu’il plante uniquement quand cp n’est pas un chiffre pair ? Si oui, je peux corriger ce problème.
J’ai corrigé le code, il n’y a plus de problème de plantage qui était dut au calcul d’arrondi des périodes des fractals intermédiaires.
For everyone information, code has been updated to fix the crash of the indicator due to bad periods calculation for the intermediate minor fractals.
Bonjour Nicolas et bon dimanche
c’était une question de round !!! , il ne plante plus et donne un visuel intéressant.
J’ai essayé de l’arranger pour avoir des signaux et le tester en backtest voici le code
que j’ai essayé de créer mais ça ne marche pas , je n’ai pas suffisamment de pratique
pour le modifier correctement , je compte sur toi pour y remédier .
cordialement
Madrosat
//---external parameters Indicateur Multi Fractals ZigZag High Low essais de modifications avec ajouts de signaux
//cp = 20
once lastpoint = 0
ATR = averagetruerange[cp]
///---major zigzag points
if high[cp] >= highest[2*cp+1](high) then
LH = 1
else
LH = 0
endif
if low[cp] <= lowest[2*cp+1](low) then
LL = -1
else
LL = 0
endif
if LH = 1 then
TOPy = high[cp]
TOPx = barindex[cp]
endif
if LL = -1 then
BOTy = low[cp]
BOTx = barindex[cp]
endif
if LH>0 and (lastpoint=-1 or lastpoint=0) then
signal = 1
DRAWTEXT(\"º\",LTOPx,LTOPy+ATR/2,Dialog,Bold,20) coloured(200,0,0,255)
lastpoint = 1
endif
if LL <0 and (lastpoint=1 or laspoint=0) then
signal=-1
DRAWTEXT(\"º\",LBOTx,LBOTy-ATR/2,Dialog,Bold,20) coloured(0,200,0,255)
laspoint = -1
endif
////---mino zigzag points
if high[round(cp/2)] >= highest[cp+1](high) then
LLH = 1
else
LLH = 0
endif
if low[round(cp/2)] <= lowest[cp+1](low) then
LLL = -1
else
LLL = 0
endif
if LLH = 1 then
LTOPy = high[round(cp/2)]
LTOPx = barindex[round(cp/2)]
endif
if LLL = -1 then
LBOTy = low[round(cp/2)]
LBOTx = barindex[round(cp/2)]
endif
if LLH>0 then
signal=0.5
DRAWTEXT(\"º\",LTOPx,LTOPy+ATR/2,Dialog,Bold,20) coloured(200,0,0,255)
endif
if LLL<0 then
signal=-0.5
DRAWTEXT(\"º\",LBOTx,LBOTy-ATR/2,Dialog,Bold,20) coloured(0,200,0,255)
endif
return signal as\"signal\"
Ce que tu as fait semble correct pour moi. La variable que tu as nommé “signal” doit correctement retourné ce qu’a était le dernier fractal trouvé sur l’historique. Il ne faut pas oublier que les fractals s’affichent dans le passé et ne sont bien entendu pas affiché en temps réel. On ne peut jamais savoir si on se situe à un dernier plus haut ou à un dernier plus bas en temps réel.
Bonjour Nicolas
merci pour cette précision que je soupçonnais , donc difficile à utiliser dans une stratégie .
Le code ci-dessus n’est pas bon La plateforme me retourne : La variable suivante n’est pas utilisée dans le programme : topy topx boty botx
Bonne journée
Madrosat
Ces variables ne sont utiles que pour le tracement des objets graphiques de l’indicateur. Pour les fractals, seules les variables LL,LH,LLL et LLH sont importantes et nécessaires.
ok
Merci Nicolas
Bonjour Nicolas.Est-ce que la V3 permet de créer des trendlines au delà du prix actuel (sur la droite) ?Par exemple, est-ce qu’un indicateur trendline basé sur le Multi Fractals ZigZag High/Low serait réalisable ? Tracer une ligne à chaque nouveau point haut / bas. Une ligne rouge reliant les points haut et verte les points bas.
Oui ce serait possible. Dans la 10.3, les DRAWLINE se projette à travers tout le graphique, sur la droite et la gauche.
Bonjour,
Est il possible d’avoir ce code avec la version V2 , n’ayant pas encore la V3 ? Sans forcement avec les dessins, un point à la place devrait être suffisant non ?
Merci pour les réponses.
I made a version for 10.2
Nice! You could share them on the Library.
I’m sorry, it’s not true
Salut Nicolas,
une question: cet indicateur repaints que tous basés sur le zigzag?
Par définition un ZigZag repeint le passé puisque que l’on ne sait jamais si le dernier plus haut ou plus bas atteint est bien le dernier. Sauf que celui-ci ne le permet pas puisqu’il se base sur les fractals et que dans le code je lui indique qu’il ne pourra pas le faire (pas de modification d’un signal plus bas pas un nouveau plus bas). Donc c’est un zigzag “adapté” que tu trouveras dans cet indicateur.
Merci Nicolas. Cette semaine, nous allons prouver en temps réel. Je vais vous informer des résultats.
Bien, mais il ne faut pas oublier qu’un fractal s’affiche dans le passé, pas en temps réel, car il faudra évidemment tester ses conditions .. avant de l’afficher 🙂
Pour qu’il soit plus rapide, tu peux modifier le paramètre “cp”, à 20 périodes par défaut.
Bonsoir
Personne n’a réussi à mettre une version pour la V2 ?
Merci bonne soirée.
Thank you Nicolas for sharing this wonderful indicator with us.
Can you please advise how can we use the symbols in a scanner. I want to scan all stocks that had symbol drawn on their daily charts in the previous 5 days.
Thanks,
Assaf
I have coded your request. The stock screener is now available in the Library : http://www.prorealcode.com/prorealtime-market-screeners/fractals-stock-screener/
Hi Nicholas,
I am a newbie, just registered on this website today. Is your indicator free to use on Pro Real Time? Thanks in advance.
Everything’s here is for free! Download and import files into your platform that’s all 🙂
Thanks Nicholas for your swift response. With this indicator, the green square is a potential buy while the red square is a potential sell,right? Can this be applied to any market?
It depends how you trade it. It could also be considered as potential breakout points because of identifying the recent highest high and lowest low. It is only calculated with price information, so yes it is an “universal” indicator.
brilliant thanks
Hi Nicolas,
I am getting syntax error with DrawText command while using this indicator. The error is as below:
One of the following characters would be more suitable than “(“
Can you please help.
Hi Nicolas, looking at the previous posts, you have already answered this question. Is there a code, I could use on version 10.2?
marche parfaitement, merci pour cet indicateur très utile
Hi,Does multi fractals zigzag high /Low work on Mt4?
How can i make it working on Mt4?
Thanks,
Hello this website is dedicated to prorealtime programming. I can help people with PRT and convert MT4 indicators for it, but I can’t help about MT4 related stuff sorry…
Bonjour, PRT peut ne pas reconnaître la valeur CP. Dans ce cas, j’ai simplement modifié le début :
//---external parameters Indicateur Multi Fractals ZigZag High Low essais de modifications avec ajouts de signaux
//cp = 20
Que j’ai remplacé du coups par :
//---external parameters
cp = 20
Un tout petit changement qui débloque le code. Merci pour le partage !
Hello Nicolas,
The first thing I want to say is: thanks for your work. And the second is: sorry for my english 🙂
I have a question. Does this indicator use the Zig Zag indicator? I understand that the zig zag indicator can not be used live because it recalculates once passed.
So all indicators based on the zig zag flag are 100% winners.
I ask the question because I see that this indicator has almost total success and I find it impressive if it does not recalculate once passed.
Thank you very much for your time
This indicator does not use zig zag at all. It’s built on fractals and it doesn’t repaint. I called it zigzag because it shows peaks and valleys too.
Hi for some reason i cant get this indicator to look like yours. Any ideas?
What is your problem exactly please?
Hey Nicolas, great stuff! Just starting to play around with it. Can you explain to me how, if i would like to get a fib level between two points (high-low/low-high)?
Yes, could probably be a good coding exercise, please add a request on forums!
Ok. I’ll do that!
Nothing gets added, a indicator sections opens on the bottom part of the chart but nothing anywhere all blank
Please add it on price instead. Use the wrench at the upper left side of the chart.
Hi Nicolas,
would it be possible to have a tradins system based on this indicator?
I tried but it’s too complicate for my skills…
Thanks a lot!
thats worked thanks for your time.
Hi! Is there any way to set an audio alarm or pop-out box alert when the fractal appear? Any suggestions is greatly appreciated.
Thank you
Ken
Buongiorno Nicolas, mi scuso per l’ignoranza, ma non ho capito come si può utilizzare questo indicatore. Potrebbe spiegarlo brevemente?
Grazie!
Questo indicatore disegna picchi massimi ei minimi basso per determinare le zone di supporto e resistenza. È tutto 🙂
Hello Nicolas
Can this code be transferred to Tradingview charts? Thanks
Certainly, but I will not do it.
Bonjour Nicolas,
Je tenais à te remercier pour tout ce travail incroyable que tu fais pour nous !
Merci quel indicateur de qualité !!
Je te souhaite que le meilleur
@Nicolas,
Thank you for amazing stuff you do here!
I tried to make this into an indicator but it seems to lag ahead! is this by design or I do something wrong ? 🙂
It’s not lagging, Fractals are confirmed few bars only after a new peak or trough had been discovered.
Ok! Thanx!
Hello Nicolas,
Ok, i will try to speak english…
I suppose this indicator repaint ?… am I right ?
Thank’s
Sebastien
No it doesn’t. Points are drawn afterwards.
Hi Nicolas,
i wanna use this indicator in an automatica trading strategy. but it seems that is not possibile. I’ve changed the code so the function will return the last value obtained but it seems that it’s not in sync with the draw. It a my error or is not possible to return the value for this indicator?
//---external parameters
//cp = 20
once lastpoint = 0
ATR = averagetruerange[cp]
//---major zigzag points
if high[cp] >= highest[2*cp+1](high) then
LH = 1
else
LH = 0
endif
if low[cp] <= lowest[2*cp+1](low) then
LL = -1
else
LL = 0
endif
if LH = 1 then
TOPy = high[cp]
TOPx = barindex[cp]
endif
if LL = -1 then
BOTy = low[cp]
BOTx = barindex[cp]
endif
if LH>0 and (lastpoint=-1 or lastpoint=0) then
DRAWTEXT(\"░\",TOPx,TOPy+ATR/2,Dialog,Bold,20) coloured(200,0,0,255)
lastpoint = 1
last = 2
endif
if LL<0 and (lastpoint=1 or lastpoint=0) then
DRAWTEXT(\"░\",BOTx,BOTy-ATR/2,Dialog,Bold,20) coloured(0,200,0,255)
lastpoint = -1
last = -2
endif
//---mino zigzag points
if high[round(cp/2)] >= highest[cp+1](high) then
LLH = 1
else
LLH = 0
endif
if low[round(cp/2)] <= lowest[cp+1](low) then
LLL = -1
else
LLL = 0
endif
if LLH = 1 then
LTOPy = high[round(cp/2)]
LTOPx = barindex[round(cp/2)]
endif
if LLL = -1 then
LBOTy = low[round(cp/2)]
LBOTx = barindex[round(cp/2)]
endif
if LLH>0 then
DRAWTEXT(\"º\",LTOPx,LTOPy+ATR/2,Dialog,Bold,20) coloured(200,0,0,255)
last = 1
endif
if LLL<0 then
DRAWTEXT(\"º\",LBOTx,LBOTy-ATR/2,Dialog,Bold,20) coloured(0,200,0,255)
last = -1
endif
RETURN last as \"last\"
Seems ok to me. However, you can take a look at this strategy that already show how to use it: https://www.prorealcode.com/prorealtime-trading-strategies/fractal-breakout-intraday-strategy-eurusd-1h/
Hi Nicolas. I am very impressed with your work!
For real-time charts, could the Multi Fractals High/Low indicator be adapted so that it triggers an alert when a high or low point is created?
It has been discussed many times, I believe already in the comments of this post or even in the forums. Please make a quick search 🙂
please nicolas, ondas de wolf
Hi Colin,
How would one add horizontal lines from the pivot points? I’d like to try to create a system where one buys the breakout above the line. Thankyou.
HI Realpro, did you ever find out how to add horizontal lines from these pivot points?
Thanks
I don’t understand which folder we’re to put this file. couldn’t find it in my indicator folder after copyin it there, same thing as Template folder. What’s needed to be done, please advise. Thanks
https://www.prorealcode.com/import-export-prorealtime-code-platform/
HI Nicolas,
Thank you for the indicator. However, I am having a tough time loading the indicator onto metatrader 4, as I am not familiar with the the platform on the youtube video made. Please help
This website is dedicated to prorealtime programming, these codes are not compatible with MT4!
bonjour, tres indicateur, juste une question, les points apparaissent a la cloture de la bougie ou apres confirmation de la suivante ?
Les points hauts et bas apparaissent après une confirmation de X bougies définis par la variable “cp” paramétrable.
et aussi, quand y a le rond et la grille, cela veut dire que le signal est plus fort ?
donc on peut scalper directement la bougie suivante, tres bon indicateur, bravo encore nicolas
Merci Nicolas pour cet indicateur à variable cp ajustable
comment relier les points zigzag non pas par classe (points mineurs ou majeur) mais par leur succession alternative de high et de low
Pour créer un espèce de canal ?
Encore félicitation pour cette réactivité.
Je ne pensais pas aller aussi lojn mais si c’est faisable, les points de contact étant de potentiels point de rebond et on peut aller jusqu’à décompter (comme les vagues d’Eliott au sein d’un canal) cf indice DJ. Encore merci
Merci de faire une demande spécifique à ce sujet dans le forum ProBuilder. J’y regarderai alors dés que possible.
Merci pour le code ,vous dites que l’on peut l’utiliser avec 123 pattern,pourriez vous détailler cela avec un exemple merci
Vous trouverez de nombreux exemples de ce type de pattern en cherchant sur google 🙂 L’idée étant de détecter facilement les pics et creux avec cet indicateur et d’identifier les breakouts.
Here is this indicator with Fibo retracement
//—external parameters
//cp = 20
r=255
g=0
b=0
once lastpoint = 0
ATR = averagetruerange[cp]
//—major zigzag points
if high[cp] >= highest[2*cp+1](high) then
LH = 1
else
LH = 0
endif
if low[cp] 0 and (lastpoint=-1 or lastpoint=0) then
DRAWTEXT(“▼”,TOPx,TOPy+ATR/2,Dialog,Bold,20) coloured(200,0,0,255)
lastpoint = 1
NewPeak = 1
LastHigherBarindex = TOPx
LastHigher = TOPy
startbartop = LastHigherBarindex
else
NewPeak = 0
endif
if LL= highest[cp+1](high) then
LLH = 1
else
LLH = 0
endif
if low[round(cp/2)] 0 then
DRAWTEXT(“º”,LTOPx,LTOPy+ATR/2,Dialog,Bold,20) coloured(200,0,0)
endif
if LLL<0 then
DRAWTEXT("º",LBOTx,LBOTy-ATR/2,Dialog,Bold,20) coloured(0,200,0)
endif
if NewPeak then
fullrange = abs(lasthigher-lastlower)
fibo236 = lastlower+(fullrange*0.236)
fibo382 = lastlower+(fullrange*0.382)
fibo50 = lastlower+fullrange/2
fibo618 = lastlower+(fullrange*0.618)
fibo764 = lastlower+(fullrange*0.764)
startbar = startbarbot
endbar = startbartop
//plot fibonacci levels
if startbarlastplot then
drawsegment(startbar,lasthigher,endbar,lasthigher) coloured(r,g,b)
drawtext(“100%”,endbar,lasthigher,Dialog,Standard,10) coloured(r,g,b)
drawsegment(startbar,lastlower,endbar,lastlower) coloured(r,g,b)
drawtext(“0%”,endbar,lastlower,Dialog,Standard,10) coloured(r,g,b)
drawsegment(startbar,fibo236,endbar,fibo236) coloured(r,g,b)
drawtext(“23.6%”,endbar,fibo236,Dialog,Standard,10) coloured(r,g,b)
drawsegment(startbar,fibo382,endbar,fibo382) coloured(r,g,b)
drawtext(“38.2%”,endbar,fibo382,Dialog,Standard,10) coloured(r,g,b)
drawsegment(startbar,fibo50,endbar,fibo50) coloured(r,g,b)
drawtext(“50%”,endbar,fibo50,Dialog,Standard,10) coloured(r,g,b)
drawsegment(startbar,fibo618,endbar,fibo618) coloured(r,g,b)
drawtext(“61.8%”,endbar,fibo618,Dialog,Standard,10) coloured(r,g,b)
drawsegment(startbar,fibo764,endbar,fibo764) coloured(r,g,b)
drawtext(“76.4%”,endbar,fibo764,Dialog,Standard,10) coloured(r,g,b)
lastplot = startbar
endif
endif
if NewDown then
fullrange = abs(lasthigher-lastlower)
fibo236 = lasthigher-(fullrange*0.236)
fibo382 = lasthigher-(fullrange*0.382)
fibo50 = lasthigher-fullrange/2
fibo618 = lasthigher-(fullrange*0.618)
fibo764 = lasthigher-(fullrange*0.764)
startbar = startbartop
endbar = startbarbot
//plot fibonacci levels
if startbarlastplot then
drawsegment(startbar,lasthigher,endbar,lasthigher) coloured(r,g,b)
drawtext(“0%”,endbar,lasthigher,Dialog,Standard,10) coloured(r,g,b)
drawsegment(startbar,lastlower,endbar,lastlower) coloured(r,g,b)
drawtext(“100%”,endbar,lastlower,Dialog,Standard,10) coloured(r,g,b)
drawsegment(startbar,fibo236,endbar,fibo236) coloured(r,g,b)
drawtext(“23.6%”,endbar,fibo236,Dialog,Standard,10) coloured(r,g,b)
drawsegment(startbar,fibo382,endbar,fibo382) coloured(r,g,b)
drawtext(“38.2%”,endbar,fibo382,Dialog,Standard,10) coloured(r,g,b)
drawsegment(startbar,fibo50,endbar,fibo50) coloured(r,g,b)
drawtext(“50%”,endbar,fibo50,Dialog,Standard,10) coloured(r,g,b)
drawsegment(startbar,fibo618,endbar,fibo618) coloured(r,g,b)
drawtext(“61.8%”,endbar,fibo618,Dialog,Standard,10) coloured(r,g,b)
drawsegment(startbar,fibo764,endbar,fibo764) coloured(r,g,b)
drawtext(“76.4%”,endbar,fibo764,Dialog,Standard,10) coloured(r,g,b)
lastplot = startbar
endif
endif
RETURN
Thanks for this. Missing a zero in line 18 though.
and in line 37…
In fact, it seems this code is not quite optimal. @Nicolas, is there a way to incorporate your Multi Fractals ZigZag High/Low code above with the Perfect Trend Line screener (https://www.prorealcode.com/topic/ayuda-screener-indicador-perfect-trend-line/#post-51291) so that when the trendline is broken to the upside for example, it auto draws the Fibonacci extensions on the CD leg (if you think of a typical ABCD pattern)? This would be a similar approach to the Ross Hook, except would flag an entry closer to the BC retracement level than Ross Hook (which triggers an entry when price moves through the B point). Thank you in advance.
Not optimal for what please? It is possible to combine all codes altogether if you want. Please open a dedicated topic for each of your demand.
Dear Nicolas – your Multi Fractals ZigZag High/Low gives me quite good results – thanks for this! I would like to screen the markets with this Indicator but can not find it under “Screeners”. As I’m quite new here, would like to ask you if you can help. Thanks.
There must be a lot of screeners built upon this indicator in the forums. First I found is here: https://www.prorealcode.com/topic/multi-fractales-zig-zag-supports-resistances/#post-29985
Thanks a lot Nicolas!