Hello everyone,
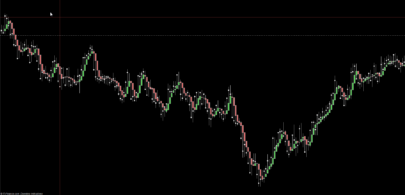
One of my friends rightly pointed out to me that the forex / stock exchange courses are a bit like a REVERSI (or OTHELLO) game.
Especially the forex courses that do not present gaps, except for weekends.
It is not wrong, when looking at a graph, even with the eye of a neophyte.
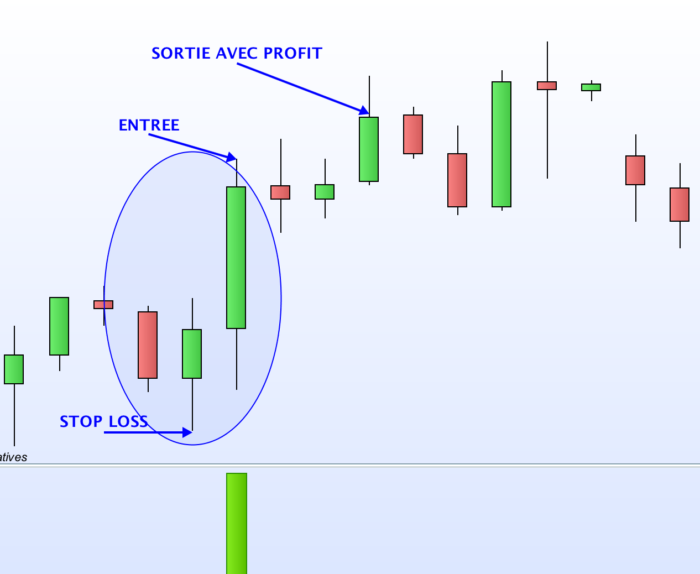
In fact, the goal of the game is to find a particular pattern, the one I had called (in one of my other articles dating back almost 3 years ago), a « Confirmed Engulfing ».
It is simply a “engulfing”, confirmed by a candle in the same direction.
When looking at this type of pattern, the idea is to buy (in case of bullish pattern) or to sell (in case of bearish pattern).
Logically, the stop loss is placed at the opposite end of the pattern.
What about the take profit ???
I used a take profit equal to the stop loss before realizing that this wasn’t really profitable.
Actually, as this pattern has a very large stop loss, the idea is to quickly close the position, as soon as a candle closes squarely above the entry point.
Obviously, the stop loss is much wider than the take profit.
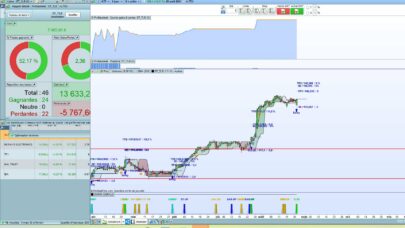
But you will be surprised at the high success rate of this strategy !
I used it at my beginning, making some interesting gains.
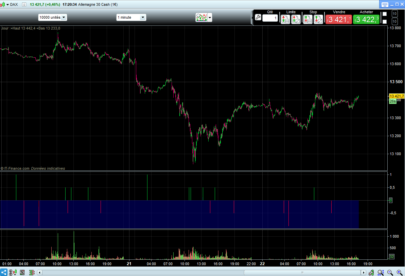
On the other hand, the opportunities are relatively few, you have to watch several pairs on the forex / several indices (like DAX, CAC40, etc.)
You can even create a screener from the code.
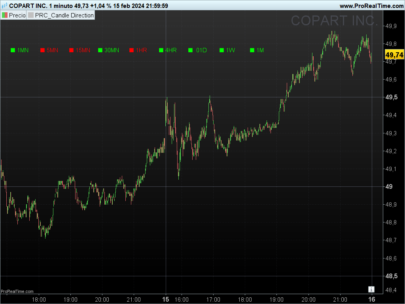
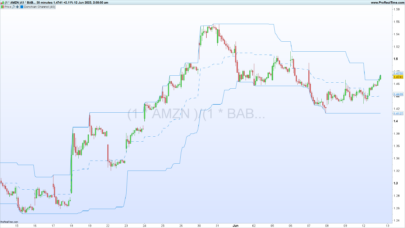
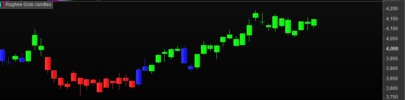
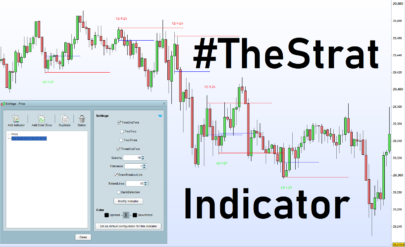
Speaking of this one, I created the corresponding indicator, which highlights the patterns.
On the picture, the indicator is green when you have a “Reversi Bullish” pattern, and in red when you have a “Reverse Bear” pattern.
Here is the code (set the indicator to « Histogram », and configure the color as you wish) :
|
1 2 3 4 5 6 7 8 9 10 11 12 13 14 15 16 17 18 19 20 21 22 23 24 25 26 27 28 29 |
Indicateur = 0 // HAUSSIER c1a = close > open c2a = close[1] > open[1] c3a = high[1] > high[2] and low[1] < low[2] // BAISSIER c1v = close < open c2v = close[1] < open[1] c3v = high[1] > high[2] and low[1] < low[2] IF c1a and c2a and c3a THEN Indicateur = 1 ELSIF c1v and c2v and c3v THEN Indicateur = -1 ENDIF return Indicateur |
Share this
No information on this site is investment advice or a solicitation to buy or sell any financial instrument. Past performance is not indicative of future results. Trading may expose you to risk of loss greater than your deposits and is only suitable for experienced investors who have sufficient financial means to bear such risk.
ProRealTime ITF files and other attachments :
Find other exclusive trading pro-tools on ![]()
PRC is also on YouTube, subscribe to our channel for exclusive content and tutorials

What is the timeframe(s) you woul suggest to use for this method ?On Forex and/or on stock market ?
Hello,
Higher timeframes are better.
I suggest D1 or H4.Best regards,
hello, I propose to add another conditions:
ie: haussier:
close > open and close >= sma7 (sample moving average 7)
Is it possible adding this condition ?
I’d be interested in the actual profit of this – in the example the stop range is at least 2-3 times the actual profit – 1-2 stop outs per 10 trades would completely wipe out the small profits