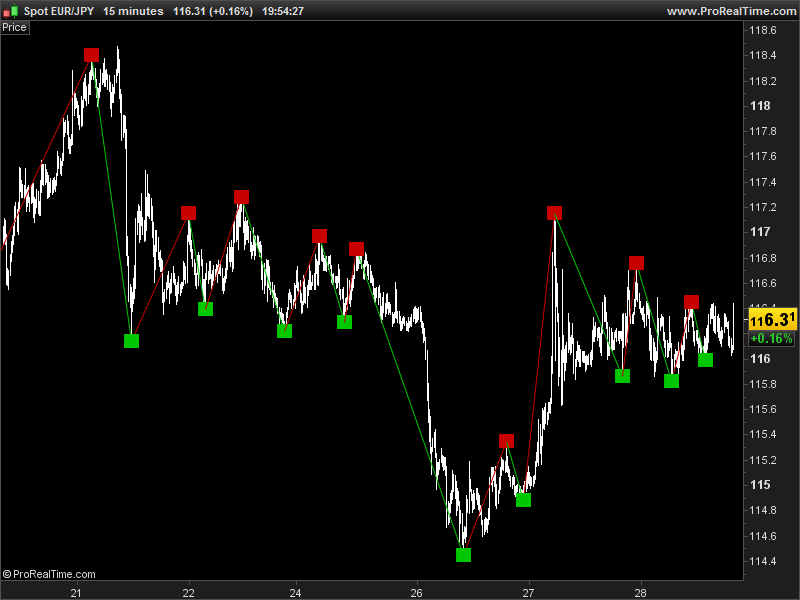
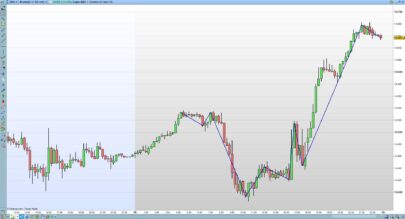
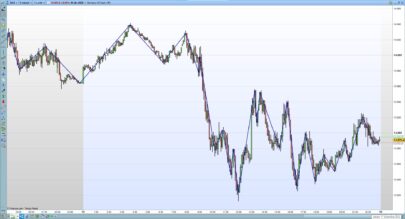
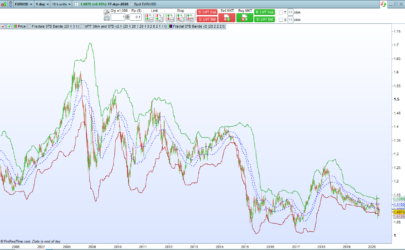
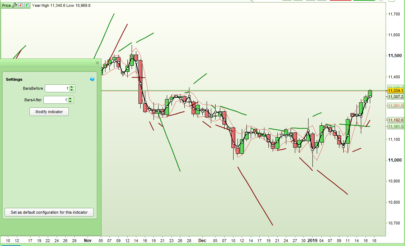
This indicator is a new attempt to draw compatible zigzag for automated trading with ProOrder.
The zigzag are drawn with the new fractal point that is contrarian to the last one.
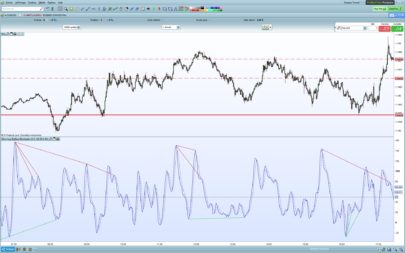
The “cp” parameter control the depth of analysis to find fractals, higher is the value, deeper are the valleys and taller the peaks. Default value is 20.
|
1 2 3 4 5 6 7 8 9 10 11 12 13 14 15 16 17 18 19 20 21 22 23 24 25 26 27 28 29 30 31 32 33 34 35 36 37 38 39 40 41 42 43 44 |
//---external parameters //cp = 20 once lastpoint = 0 if high[cp] >= highest[2*cp+1](high) then LH = 1 else LH = 0 endif if low[cp] <= lowest[2*cp+1](low) then LL = -1 else LL = 0 endif if LH = 1 then TOPy = high[cp] TOPx = barindex[cp] endif if LL = -1 then BOTy = low[cp] BOTx = barindex[cp] endif if LH>0 and (lastpoint=-1 or lastpoint=0) then DRAWSEGMENT(lastX,lastY,TOPx,TOPy) COLOURED(200,0,0,255) DRAWTEXT("■",TOPx,TOPy,Dialog,Bold,20) coloured(200,0,0,255) lastpoint = 1 lastX = TOPx lastY = TOPy endif if LL<0 and (lastpoint=1 or lastpoint=0) then DRAWSEGMENT(lastX,lastY,BOTx,BOTy) COLOURED(0,200,0,255) DRAWTEXT("■",BOTx,BOTy,Dialog,Bold,20) coloured(0,200,0,255) lastpoint = -1 lastX = BOTx lastY = BOTy endif RETURN |
Share this
No information on this site is investment advice or a solicitation to buy or sell any financial instrument. Past performance is not indicative of future results. Trading may expose you to risk of loss greater than your deposits and is only suitable for experienced investors who have sufficient financial means to bear such risk.
ProRealTime ITF files and other attachments :
Find other exclusive trading pro-tools on ![]()
PRC is also on YouTube, subscribe to our channel for exclusive content and tutorials
Good Job Nicolas,
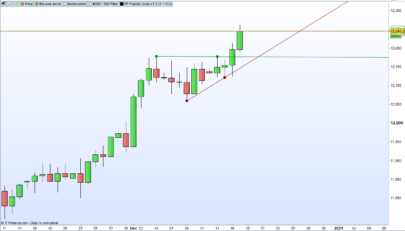
But may be there is still a problem as you see on my graph ?
Have a nice day
Zilliq
Ps: I can’t post a graph with the forum (Don’t have permission…)
http://zupimages.net/up/16/30/ue5x.png
It’s normal. You haven’t read the code obviously 🙂
As you already know it, PRT don’t allow to redraw past informations. So I disallow the others same informations (in your case a green box), to be shown as the time passing by. But you can change it if you like by deleting all “lastpoint” references in the code.
Ciao nicolas,
anche io non riesco ad inserire il tuo codice .
mi da errore di sintassi linea 29 e 30 .
come posso riparare ?
potresti postare un codice leggibile ?
grazie
miguel
Questo indicatore è compatibile solo con la versione 10.3 di ProRealTime.
Thanks Nicolas,
I didn’t read the code at all 😉
Have a good day
Zilliq
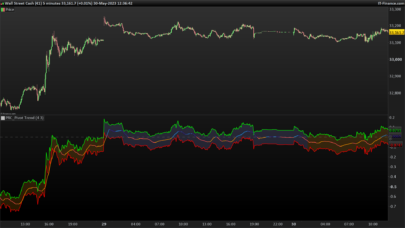
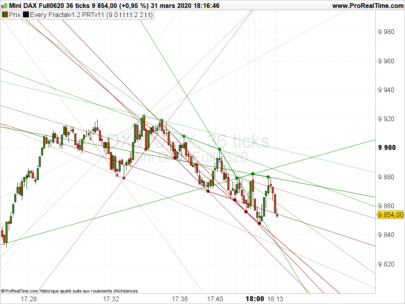
Sur Telefonica n’apparaissent pas les derniers plus haut/plus bas !!?? un commentaire svp
http://zupimages.net/viewer.php?id=16/30/dezu.jpg
En effet, c’est ce que je viens de spécifier à Zilliq. Puisque on ne peut pas supprimer et retracer des éléments déjà tracés, j’ai pris le partie de ne tracer que les plus haut et plus bas que si le précédent était un signal inverse. Tu peux modifier ce comportement en supprimant tout ce qui se rapporte à “lastpoint” dans le code. Bien entendu, les précédents signaux resteront tracés sur le graphique.
Nicolas ,
con IG si collega alla versione 10.2
ho provato ad inserire l’indicatore nella versione in demo 10.3
lo accetta ma non si vede nulla esce completamente bianco. 🙁
cosa miguel immagine dici in proposito ?
grazie per la tua collaborazione
miguel
Bonjour je reviens sur cette indicateur intéressant, ne peut on sur la V2 mettre des croix ou autre à la place des carrés coloriés afin d’indiquer le fractale plus bas, plus haut du zigzag ? si oui que faut il remplacer ?
merci….
On peut retourner les valeurs de BOTy et de TOPy pour connaître les derniers Fractals trouvés. Puisqu’on ne peut pas tracer dans le passé avec la version 10.2, ces valeurs apparaîtront à partir du moment où elles seront trouvés et donc en décalage par rapport la bougie en question, le rendu visuel ne sera pas du tout le même.
D’accord cela donnerai quoi au niveau du code, je vais voir au niveau visuel si c’est parlant ou pas assez pertinent.. merci pour la réponse rapide…
L’indicateur en question existe déjà pour la version 10.2, c’est celui-ci = http://www.prorealcode.com/prorealtime-indicators/bill-williams-fractals/
Suite à une autre demande, un screener pour la détection des instruments ayant eu un nouveau Fractal depuis les X dernières bougies a était codé et est disponible ici : http://www.prorealcode.com/prorealtime-market-screeners/fractals-stock-screener/
Hi Nicolas. Nice indicator, as always!
It could be very useful to detect some waves on the graphic. Could it be possible to mark the last 5 points with the text 1, 2, 3, 4 and 5, in addition of the green and red boxes?
Yes of course, please add a new request in the ProBuilder forum.
Thanks Nicolas. Done.
ondas de wolf please
Ciao Nicolas, potresti fare un esempio di come l’utilizzeresti in un sistema automatico invece del normale zig zag?
Grazie
Massimo
Ci sono già molte strategie che utilizzano questo indicatore nella libreria, basta cercare “zigzag” con lo strumento di ricerca del sito.
good day
I am trading the SA 40 on IG markets , I am using the basics like trend lines and zig zag ,but I don’t see anyone write any strategies on the SA 40 , I want to know why and where can I find some of those
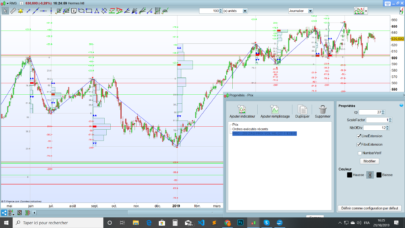
Ciao Nicolas, perchè quando aggiungo l’indicatore, viene aggiunto in basso e non sul grafico? Grazie mille!
Por favor agrégalo al precio, gracias.
non ho capito perdonami!
Dear Nicolas,
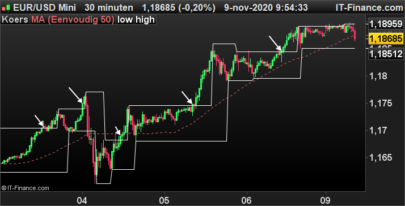
I extended your Fractals Zigzag indicator with a minimum percentage of change before a fractal point will be set, like the percentage you can choose in the standard PRT-ZIGZAG indicator.
This is meant to avoid Fractal Points in a relative flat market.
I tested the adjusted code, and it seems to work correctly.
The changes I made are shown in CAPITAL LETTERS below, (all other code remains the same.)
(I based the adjusted Fractals Zig Zag code on the CLOSE, not on the original high/low in your code, because the original PRT ZigZag indicator is also based on the Close)
//—external parameters
cp = cp1 // default 20
Perc = perc1/10000 // default 2% = highest[2*cp+1](close) AND CLOSE[CP] >= LOWEST[2*CP+1](CLOSE)*(1+ PERC) then //top, base for short <== RENEWED LINE
LH = 1
else
LH = 0
endif
if close[cp] <= lowest[2*cp+1](close) AND CLOSE[CP] <= HIGHEST[2*CP+1](CLOSE)*(1- PERC) then //bottom, base for long = highest[2*cp+1](close) and close[cp] >= lowest[2*cp+1](close)*(1+ Perc) then //top, base for short
LH = 1
else
LH = 0
endif
if close[cp] <= lowest[2*cp+1](close)and close[cp] 0 and (lastpoint=-1 or lastpoint=0) then
DRAWSEGMENT(lastX,lastY,TOPx,TOPy) COLOURED(200,0,0,255)
DRAWTEXT(“■”,TOPx,TOPy,Dialog,Bold,20) coloured(200,0,0,255)
lastpoint = 1
lastX = TOPx
lastY = TOPy
endif
if LL<0 and (lastpoint=1 or lastpoint=0) then
DRAWSEGMENT(lastX,lastY,BOTx,BOTy) COLOURED(0,200,0,255)
DRAWTEXT("■",BOTx,BOTy,Dialog,Bold,20) coloured(0,200,0,255)
lastpoint = -1
lastX = BOTx
lastY = BOTy
endif
RETURN
Dear Nicolas,
Forget my previous post, apparently too many text with an appendix, text was mixed up,
hereby new try:
I extended your Fractals Zigzag indicator with a minimum percentage of change before a fractal point will be set, like the percentage you can choose in the standard PRT-ZIGZAG indicator.
This is meant to avoid Fractal Points in a relative flat market.
I tested the adjusted code, and it seems to work correctly.
The changes I made are shown in CAPITAL LETTERS below, (all other code remains the same.)
(I based the adjusted Fractals Zig Zag code on the CLOSE, not on the original high/low in your code, because the original PRT ZigZag indicator is also based on the Close)
//—external parameters
cp = cp1 // default 20
Perc = perc1/10000 // default 2% = highest[2*cp+1](close) AND CLOSE[CP] >= LOWEST[2*CP+1](CLOSE)*(1+ PERC) then //top, base for short <== RENEWED LINE
LH = 1
else
LH = 0
endif
if close[cp] <= lowest[2*cp+1](close) AND CLOSE[CP] <= HIGHEST[2*CP+1](CLOSE)*(1- PERC) then //bottom, base for long <== RENEWED LINE
LL = -1
else
LL = 0
endif
If you have any comments please let me know.
Kind regards, Jan
Dear Nicolas, and others,
Third comment:
my solution as presented does not work satisfactory with my previous presented code, sorry. It should present in the graph only fractal points that a x % higher or lower as the previously fractal point, but that does not always appear in the graph, sometimes the next top fractal point is even lower as the previous bottom fractal point, which is maybe caused by the limited bars used for the calculation and the setting of the point of reference, CP bars in the past ?
Alternatively code below, which is easier to read, but regrettable gives still not my desired result. Sometimes the next top fractal point is even lower as the previous bottom fractal point or vice versa,
if close[cp] >= highest[2*cp+1](close) and close[cp] >= BOTy[1] *(1+ Perc) then //top, base for short
LH = 1
else
LH = 0
endif
if close[cp] <= lowest[2*cp+1](close)and close[cp] <= TOPy[1]*(1- Perc) then //bottom, base for long
LL = -1
else
LL = 0
endif
Comments or remarks would be appreciated.
Nice weekend,
Jan
Hi Jawd, good idea. Should be interesting to discuss the code in a separated thread in the forum. I’ll meet you there, thank you.
when i add this indicator nothing happens? all black on indicator, same goes when adding it to price chart
add it on price chart, change the cp parameter according to the period you want to observe for new fractals to pop up. Be sure your PRT platform is version >= 10.3
hola buenos días: yo estoy buscando una cosa parecida para realizar con ello un indicador de divergencias con el precio y el RSI y no se donde estais escribiendo sobre éste tema, alguien podría decirmelo?
https://www.prorealcode.com/prorealtime-indicators/rsi-classical-hidden-divergences-indicator/