Trend Balance Point (TBP)

v10.3
Trend Balance Point (TBP)

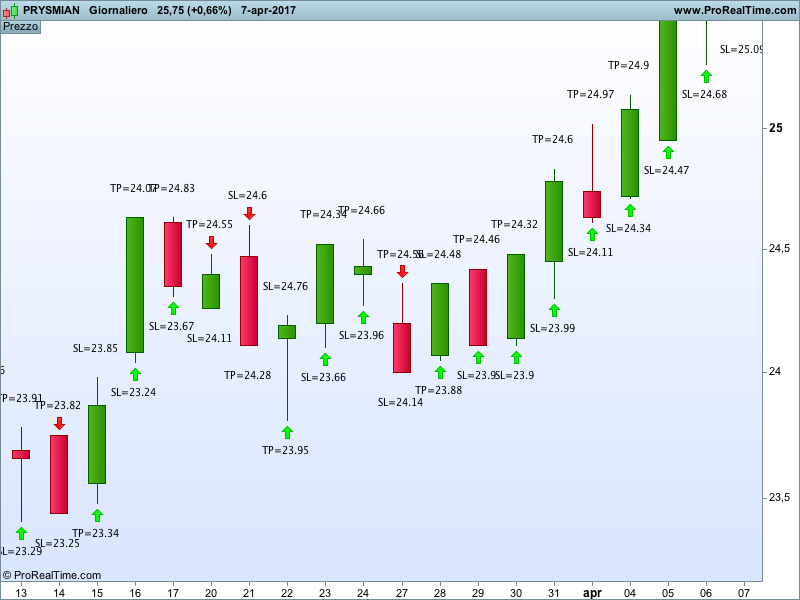
The Trend Balance Point is a system created by J. Welles Wilder and published in his book ‘New Concepts In Technical Trading Systems’. The system uses momentums to define whether to enter the market long or short and provide a Stop Loss and a Target Price for each entry. Positions are opened on THE CLOSE of the current day and closed as soon as the Target Price or the Stop Loss is hit.

According to Mr. Wilder the system works well in ranging markets and when ADX is below 20.

I personally never used this system and I haven’t done any backtesting either because PRT doesn’t allow to buy on close.

Blue skies!


Share this

Risk disclosure:

No information on this site is investment advice or a solicitation to buy or sell any financial instrument. Past performance is not indicative of future results. Trading may expose you to risk of loss greater than your deposits and is only suitable for experienced investors who have sufficient financial means to bear such risk.

ProRealTime ITF files and other attachments : How to import ITF files into ProRealTime platform?

PRC is also on YouTube, subscribe to our channel for exclusive content and tutorials

  1. AleX • 04/10/2017 #

    Ho provato la strategia sul Mib giornaliero su di un foglio excel nel mese di Gennaio, su 7 giornate in cui ADX < 20 fa il 100% di gain mentre dove ADX>20 ha risultati inferiori al 50% ed essendo che gli stop loss sono circa il triplo dei take profit la strategia è effettivamente in perdita, proverò a continuare il test in altri mesi anche considerando le commissioni che per ora non ho calcolato. Proverò a fare test più approfonditi ma sembra una strategia vincente a prima vista. 

  2. gabri • 04/10/2017 #

    Alex, grazie per avere fatto il backtest. Wilder era un piccolo genio anche se con idee non toppo ortodosse alle volte. Per sua stessa definizione questo sistema ha un rapporto risk/reward negativo (voluto) e quindi devi necessariamente vincere molto piu’ spesso di quanto perdi. Inoltre da per scontato che anche tale sistema (come gli altri che lui ha creato tra cui RSI e ADX) vengano utilizzati su strumenti con elevato Commodity Selection Index (CSI). Magari nei prossimi backtest puoi tenere conto anche di questo.
    Buona Pasqua

  3. AleX • 04/10/2017 #

    ho provato anche per febbraio e la strategia ha il 75% di risultati positivi e quelli negativi non raggiungono in ogni caso lo stop loss quindi con una perdita contenuta. Ho cercato informazioni sul CSI e sarebbe bello codificarlo su prorealtime, inoltre per poter funzionare su questa piattaforma è assolutamente necessario riuscire ad automatizzarla perché difficilmente si può aspettare ogni giorno la mezzanotte per impostare l’entrata lo stop loss e take profit per il giorno seguente. Grazie ancora per la condivisione. 

  4. gabri • 04/10/2017 #

     Codificare il CSI e’ possibile. Io uso una sua modifica (siccome lavoro solo sull’azionario molti parametri non mi servono) e si riduce a moltiplicare ADXR per ATR. Io non uso un normale ATR ma un ATR bilanciato (allego la formula). Lo screener mi restituisce le azioni con valore di CSI maggiore e poi a quel punto e’ facile.
     
    a=100*averagetruerange[periodo](close)/average[periodo](close)


  5. gabri • 04/10/2017 #

    Dopo Pasqua codifichero’ anche un altra strategia che Wilder suggerisce di usare quando il mercato e’ orizzontale che si chiama Reaction Trend System.
     

  6. Alex975 • 04/10/2017 #

    Wilder personalmente lo definisco un poeta del trading.. 
    Utilizzo alcuni strumenti di Wilder, il più delle volte modificate e vestiti sulla mia operatività, ma il CSI proprio non lo mai approfondito.
    Bel contributo da parte di tutti e due.. Alessandro

  7. AleX • 04/10/2017 #

    Vi faccio partecipi dell’evoluzione del mio studio, mi avete appassionato a Wilder che da ignorante non conoscevo. Ho provato a codificare in excel l’ADX e il Trade Balance Point come da tuo codice e i primi risultati sono ottimi direi. A breve cerco di semplificare il foglio di calcolo e se riesco a condividerlo. Non credo che si possa automatizzare la strategia perché così come concepita la maggior parte dei trade vengono chiusi in giornata e il backtest tick per tick non permette un analisi a lungo termine, oltre al problema di non poter entrare in chiusura ma solo in apertura. Sappiate però che anche entrando in apertura i risultati rimangono buoni. Quindi continuo su excel con il problema del trovare i dati corretti intraday per le varie commodities. Stay in touch 😉 

  8. gabri • 04/10/2017 #

    Grazie mille Alex!!
     

avatar
Register or

Likes

avatar avatar avatar avatar avatar avatar avatar avatar avatar avatar avatar avatar
Related users ' posts
Iván Thanks ;)
kats BONJOUR je lai mis sur du renko , il est complexe car toujours a l'envers??? Peut être ne ...
Gaspare Ciao Ivan si puo' inserire una strategia su questo indicatore per ottimizzare le variabil...
P. Marlowe Impressive work. Accurate, interesting, good background. You hit the nail on the head again....
Iván Hi! You should change $rbox, $gbox and $bbox variables. Also r,g,b for last box.
finplus Thanks Ivan.
roccafragius Ivan, I just want to say you.. very very great job!!!! Thank you so much for this indicator!...
Iván
2 weeks ago
groelandes Cuando te descargas el fichero itf, en su código no aparece toda la configuración de alertas...
Iván Si lo descargas e importas en tu PRT verás que se han creado las variables para luego config...
Iván
2 weeks ago
Danger Zones Indicator
2
Indicators
P. Marlowe Quite an impressive work, as usual. You share extremely useful tools and show an stunning ba...
Iván Thank you very much!
P. Marlowe Quite an impressive work, Iván. Extremely useful and accurate. Congratulations. Keep it up¡
lkiklkik i love it !!! thanks.
Stenozar Hi Ivan, can you translate from tradingviwe the EMA TREND METER INDICATOR? It couid be inte...
Iván Hi Yes I can. Please, create a new topic for that I will translate it.
Stenozar Hi Ivan, I've created a new topic about the indicator: https://www.prorealcode.com/topic/ema...
Iván sería así //------------------Inputs------------------------------ linreglength = 11//i...
Doddge Muchísimas gracias Iván, está genial.
superfalcio holaaa, have you run some statistics?
Doddge Hola Iván, ¿sería posible crear un screener que indique cuándo las velas coloreadas del indi...
RTR Ivan thank you for the pro-screener. I a trying to understand how to write the signals from ...
Iván Hi, Lines 62 and 63. These lines define buy and sell conditions.
el titi Bonjour, merci beaucoup pour ce partage. Je vais regarder avec attention ce script et analys...
Armand2020 Bonjour , super taf!! serait il possible de faire un poc dynamique en timeframe 5 min en mod...
philippe59139 voici ce qu'il faudrait faire ou ajouter: //poc dynamique defparam calculateonlastbars=1...
Iván
2 months ago
Iván I personally like it in daily timeframe
oliTR Many thanks Ivan, I copy/paste your code to try it but could only get a constant stable unif...
Iván Hi, I've copied the code above and it works... what asset are you trying? $indices array ...
francis59 Hello Ivan, thanks for this very nice and powerfull indicator. Could you have time to create...
Iván Hi We could find stocks with sweep on: //PRC_Sweep Institucional //version = 0 //28.0...
inverse Like the way you think Ivan ... :)
Iván Hi You should delete from the indicator code all drawing functions and all variables not us...
Iván I've created a screener to show [longcondition or shortcondition]
Chrisinobi Hallo Ivan, Danke das ist Perfekt !! Kannst du bitte in der Screener-Bibliothek die itf. hoc...
Gio56 Super idée. j'ai juste un souci. j'ai pas de barre verte mais plusieurs lignes de couleurs.....
DeathMetal change line in histgram, (click on indicator name, click on tool (
Gio56 Super merci.
Ciccarelli Franco Sembra molto interessante e volevo dei chiarimenti se possibile :Le righe commentate vanno l...
KumoNoJuzza Thank you @philippe59139 !! We finally have the VAL / VAH to play with. Could you attach th...

Top