Monthly, Weekly and Daily Activity and Equity

v10.3
Monthly, Weekly and Daily Activity and Equity

This collection of nine simple indicators is a further development of my indicator found here:

https://www.prorealcode.com/prorealtime-indicators/most-active-hours-and-months/

The first set of three indicators analyses the range to show any month/week/day of week that has historically had higher or lower than average range.

The second set analyses the volume to show any month/week/day of week that has historically had higher or lower than average volume.

The third set analyses the equity gain or loss to show any month/week/day of week that has historically had higher than average positive or negative equity.

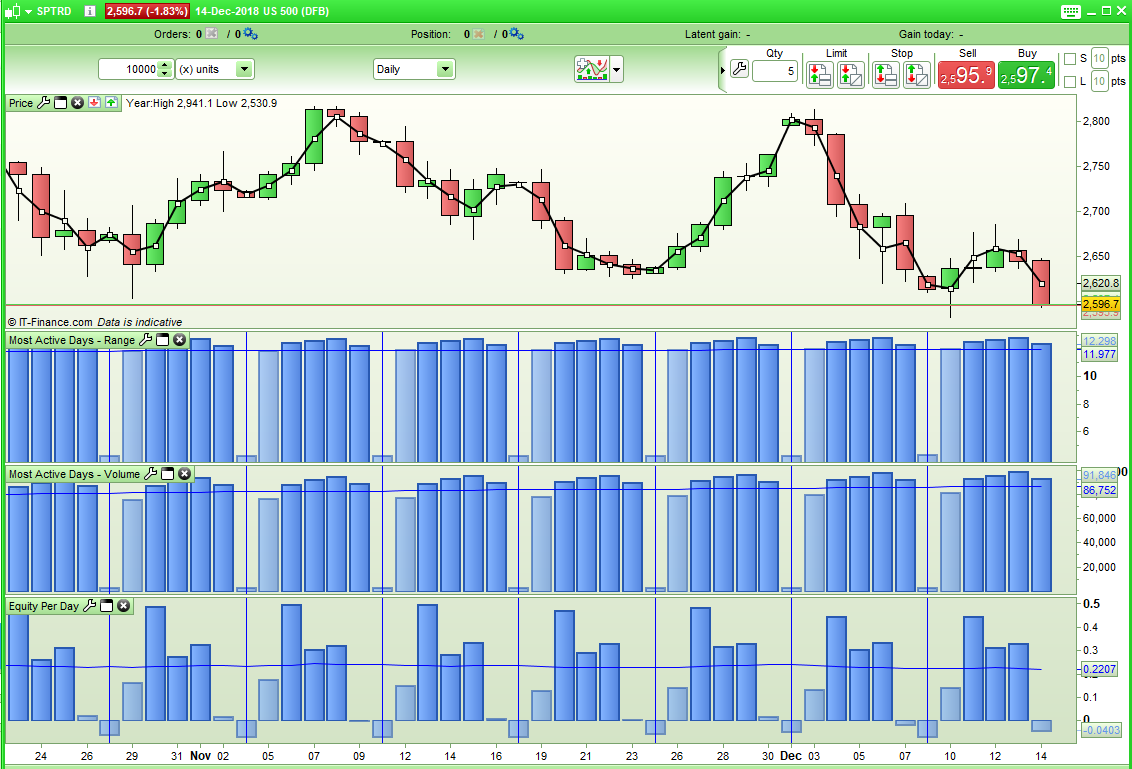
Each indicator must be applied to the relevant time frame chart – so monthly on monthly, weekly on weekly and daily on daily.

In the attached image it can clearly be seen that on the SP500 Tuesday, Wednesday and Thursday have been good days to go long and that Tuesday, Wednesday, Thursday and Friday have had above average volume and above average range, Mondays have been quieter.

We do have to consider that the Sunday candle is based on a shorter day and that there has not always been a Sunday candle in all of the historical data.

In the weekly analysis we have to take into consideration that PRT has no way to tell us what week of the year it is so I have started counting from the moment a new year is detected. Not all years have 52 x 6 trading days in them so this can lead to some years having 53 weeks. So the data around the start of a new year can be a little difficult and shorter weeks than the 6 trading days may be used leading to inaccurate returns by the indicator for those weeks either side of a new year’s start.

Also bear in mind that volume information is not available for all instruments and has only been available in PRT for recent history.

Share this

Risk disclosure:

No information on this site is investment advice or a solicitation to buy or sell any financial instrument. Past performance is not indicative of future results. Trading may expose you to risk of loss greater than your deposits and is only suitable for experienced investors who have sufficient financial means to bear such risk.

ProRealTime ITF files and other attachments : How to import ITF files into ProRealTime platform?

PRC is also on YouTube, subscribe to our channel for exclusive content and tutorials

avatar
Register or

Likes

avatar avatar avatar avatar avatar avatar avatar
Related users ' posts
Giogio hello dear Vonasi, thank you for your indicator, can I ask you for some help in order to let...
Pottar24 HI Vonasi I would like to know how can this algorithm give me the value of the last max e mi...
parthapersonal Hello Vonasi, Great work. Is it possible to replicate this to get values of "Price Line" (1...
tobytarczy Hi Vonasi, Sounds lovely, I race yachts around europe myself. Most regattas cancelled unfor...
mlouys Hello Vonasi thank for your work ! A question how can we do it for minutes ( or 15 min or x ...
Vonasi I think that would be possible but probably in a whole new indicator as detecting when a new...
SL Hi, Fer666 Thank you for sharing. If I want to show daily ST on a 10_min intraday chart...
SL correction above... system had remove"not equal" signs Line 19 : change to if WeekNo "Not...
SL OK... I had figured out... need more than that. Thank you anyway.
Vonasi That should be possible - I'll add it to my list to work on!
thierrybl Thanks a lot
B-ling1 Hi Vonasi, I love this indicator - good job! Just one question: If I want the monthly OHLC L...
TACBOLSA
5 years ago
dario ti please can you help me to understand? i know i am wrong: Long Histogram = High Volume S...
TAC Bolsa hi, I have already seen the problem and requested that it be removed until an adequate so...
sixeight Hey TAC, Did you ever find a solution to this?
Vinks_o_7 b=close > low and volume > high How can we compare volume and high of the day? (orang...
TAC Bolsa If to understand something you resort to compare Oranges and bananas. You go bad, Without e...
giumagi good morning Sir, great job your indicators! How can I reach your website or blog? please..t...
Gianluca THANK YOU!!!!!
JOSEBA que relaccion tiene la numeración de las barras del 1 al 10 que tiene cada número Tengo dos...
marcov66 Hi, it seems a very useful indicator. Unfortunately the link here for the full explanation d...
TACBOLSA Discontinued indicator. we are sorry.
Azzuerus Bonjour, je teste et j'utilise vos indicateurs depuis plusieurs années, et ils me sont dev...
bremze33 Another thing. Is it possible to make the graph lines a little thicker and not so long? Be...
giumagi Hi Sir, very good job done with this indicator, May I ask you to explain what is the line VW...
pmdr1969 Hola soy nuevo en en esto. ¿Hay algo parecido pero pudiendo tu elegir las velas a a analizar...
Nicolas Add indicator on price doesnt require any specific type of subcription. Click on the wrench ...
tahiti bonjour j'ai une petite question comment peux on enlevé la bar blanche sur la bougie en cour...
sixeight Hi Kris, is there a way to increase the number of rows? I get a loop error
Nicolas Good job Gabri, I confirm that with the new ProRealTime v11, everyone will be able to use in...
Slowlyslowly can u just help me with the exact definition of percbox , mm and period to understand will a...
Real Pro Great work gabri. I have this coded on Amibroker and I have done lots of backtesting but ne...
gabri Hi Real Pro, this indicator assists novices of the Wyckoff system. Wyckoff himself thought t...
tatie hi Gabri, I just came across the wyckoff method and was looking for the weiss wave indica...
Brisvegas Thats Awesome thank you
Vinks_o_7 Thanks Vonasi !
ALE Very Very Nice
manel Hi - Many thanks for this and your other analytical codes, stellar work - very useful ! With...
Vonasi Good idea Manel. I have posted a new version here that shows results as a percentage: https:...
Jesper Great share!

Top