

Yearly Quarterly Monthly Weekly Daily H4 H1 OHLC Lines
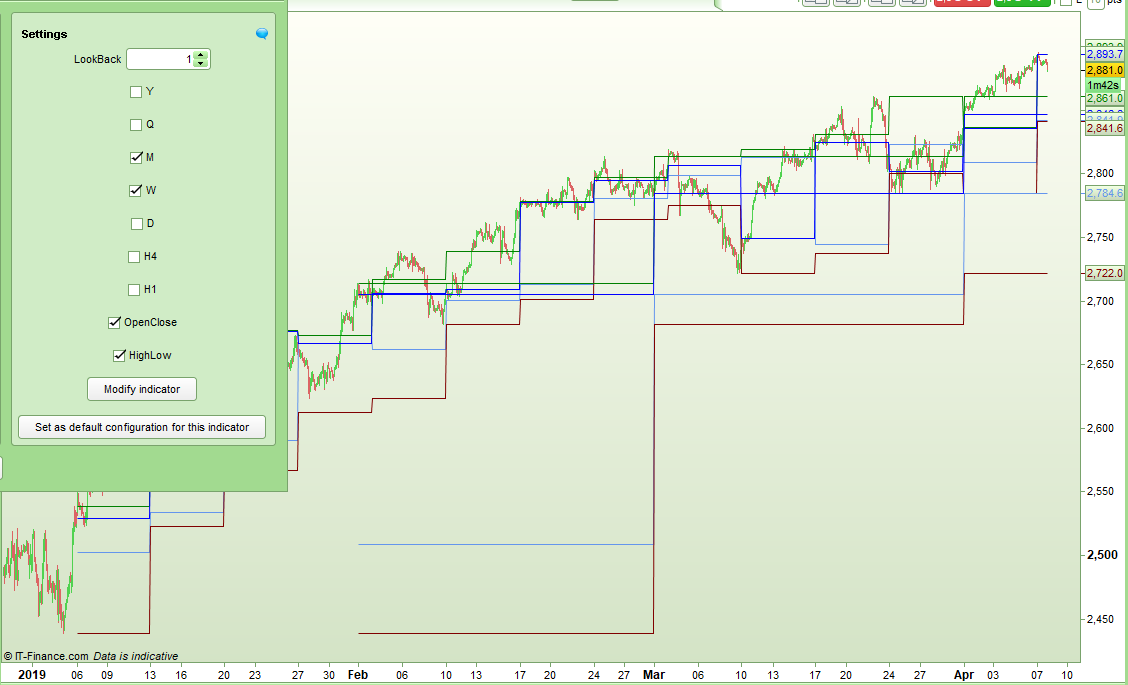
This indicator displays yearly, quarterly, monthly, weekly, daily, 4 hourly and 1 hourly OHLC (open, high, low and close) values on a price chart.
You can choose which OHLC values you want to display and also display just the high and low values or just the open and close values or all of them.
By changing the LookBack period you can display the OHLC values from any previous year, month week etc. When LookBack = 1 it displays on each candle values from the previous year, previous month, previous week etc. When LookBack = 2 it displays the values from two years ago, two months ago etc. With this feature if you add the indicator multiple times to your price chart you can for example display lines representing the last three months OHLC values.
The daily values are calculated starting at the open of the Monday candle to remove the issue of having Sunday OHLC values throughout Monday. You actually get the OHLC of Friday and Sunday combined shown on a Monday. The weekly values are calculated from the opening of the Sunday candle. If there is no Sunday or Monday candles then the week OHLC starts on whichever is the first trading day of that week.
The indicator can be used on any time frame chart but you have to have enough candles on a chart to display the values. The indicator has to be able to see a complete previous year from Jan 1st to Dec 31st before it can display any OHLC values for a year. The same for a month – it needs a whole month before it can display anything. Same for a week etc. It is not possible to display faster time frame OHLC values on a slower time frame chart. So you can’t have daily OHLC on a weekly chart for example.
It can be slow to draw if you want everything displayed on a lot of bars!
I suggest downloading the ITF file and importing it rather than cutting and pasting to ensure that you get full functionality.
Code written following the request made here: https://www.prorealcode.com/topic/conversion-tradingview-to-prorealtime-previous-ohlc/
//OHLC Y Q M W D H4 H1 v1.1
//Coded by Vonasi
//20190412

//Settings

//LookBack = 1
//Y = 0
//Q = 0
//M = 1
//W = 0
//D = 0
//H4 = 0
//H1 = 0
//OpenClose = 1
//HighLow = 1

//1 Hour
if h1 then
if openhour <> openhour[1] then
h1index = h1index + 1
h1high = 0
h1low = close
h1open = open
h1close = close

if h1index > lookback then
for j = 1 to barindex
if h1index[j] = h1index - lookback then
myh1high = h1high[j]
myh1low = h1low[j]
myh1open = h1open[j]
myh1close = h1close[j]
break
endif
next
endif
endif

h1high = max(h1high,high)
h1low = min(h1low,low)
h1close = close
endif

//4 Hour
if h4 then
if openhour <> openhour[1] and (openhour = 1 or openhour = 5 or openhour = 9 or openhour = 13 or openhour = 17 or openhour = 21) then
h4index = h4index + 1
h4high = 0
h4low = close
h4open = open
h4close = close

if h4index > lookback then
for j = 1 to barindex
if h4index[j] = h4index - lookback then
myh4high = h4high[j]
myh4low = h4low[j]
myh4open = h4open[j]
myh4close = h4close[j]
break
endif
next
endif
endif

h4high = max(h4high,high)
h4low = min(h4low,low)
h4close = close
endif


//Day
if d then
if openday <> openday[1] then
dayindex = dayindex + 1
dayhigh = 0
daylow = close
dayopen = open
dayclose = close

if dayindex > lookback then
for j = 1 to barindex
if dayindex[j] = dayindex - lookback then
mydayhigh = dayhigh[j]
mydaylow = daylow[j]
mydayopen = dayopen[j]
mydayclose = dayclose[j]
break
endif
next
endif
endif

dayhigh = max(dayhigh,high)
daylow = min(daylow,low)
dayclose = close
endif


//Week
if w then
if opendayofweek < opendayofweek[1] then
weekindex = weekindex + 1
weekhigh = 0
weeklow = close
weekopen = open
weekclose = close

if weekindex > lookback then
for j = 1 to barindex
if weekindex[j] = weekindex - lookback then
myweekhigh = weekhigh[j]
myweeklow = weeklow[j]
myweekopen = weekopen[j]
myweekclose = weekclose[j]
break
endif
next
endif
endif

weekhigh = max(weekhigh,high)
weeklow = min(weeklow,low)
weekclose = close
endif


//Month
if m then
if openmonth <> openmonth[1] then
monthindex = monthindex + 1
monthhigh = 0
monthlow = close
monthopen = open
monthclose = close

if monthindex > lookback then
for j = 1 to barindex
if monthindex[j] = monthindex - lookback then
mymonthhigh = monthhigh[j]
mymonthlow = monthlow[j]
mymonthopen = monthopen[j]
mymonthclose = monthclose[j]
break
endif
next
endif
endif

monthhigh = max(monthhigh,high)
monthlow = min(monthlow,low)
monthclose = close
endif


//Quarter
if q then
if openmonth <> openmonth[1] and (openmonth = 1 or openmonth = 4 or openmonth = 7 or openmonth = 10) then
quarterindex = quarterindex + 1
quarterhigh = 0
quarterlow = close
quarteropen = open
quarterclose = close

if quarterindex > lookback then
for j = 1 to barindex
if quarterindex[j] = quarterindex - lookback then
myquarterhigh = quarterhigh[j]
myquarterlow = quarterlow[j]
myquarteropen = quarteropen[j]
myquarterclose = quarterclose[j]
break
endif
next
endif
endif

quarterhigh = max(quarterhigh,high)
quarterlow = min(quarterlow,low)
quarterclose = close
endif


//Year
if y then
if openyear <> openyear[1] then
yearindex = yearindex + 1
yearhigh = 0
yearlow = close
yearopen = open
yearclose = close

if yearindex > lookback then
for j = 1 to barindex
if yearindex[j] = yearindex - lookback then
myyearhigh = yearhigh[j]
myyearlow = yearlow[j]
myyearopen = yearopen[j]
myyearclose = yearclose[j]
break
endif
next
endif
endif

yearhigh = max(yearhigh,high)
yearlow = min(yearlow,low)
yearclose = close
endif

//Remove zero value plotting at start and unwanted lines
if h1index < lookback or not h1 or not openclose then
myh1open = undefined
myh1close = undefined
endif
if h1index < lookback or not h1 or not highlow then
myh1high = undefined
myh1low = undefined
endif

if h4index < lookback or not h4 or not openclose then
myh4open = undefined
myh4close = undefined
endif
if h4index < lookback or not h4 or not highlow then
myh4high = undefined
myh4low = undefined
endif

if dayindex < lookback or not d or not openclose then
mydayopen = undefined
mydayclose = undefined
endif
if dayindex < lookback or not d or not highlow then
mydayhigh = undefined
mydaylow = undefined
endif

if weekindex < lookback or not w or not openclose then
myweekopen = undefined
myweekclose = undefined
endif
if weekindex < lookback or not w or not highlow then
myweekhigh = undefined
myweeklow = undefined
endif

if monthindex < lookback or not m or not openclose then
mymonthopen = undefined
mymonthclose = undefined
endif
if monthindex < lookback or not m or not highlow then
mymonthhigh = undefined
mymonthlow = undefined
endif

if quarterindex < lookback or not q or not openclose then
myquarteropen = undefined
myquarterclose = undefined
endif
if quarterindex < lookback or not q or not highlow then
myquarterhigh = undefined
myquarterlow = undefined
endif

if yearindex < lookback or not y or not openclose then
myyearopen = undefined
myyearclose = undefined
endif
if yearindex < lookback or not y or not highlow then
myyearhigh = undefined
myyearlow = undefined
endif

return myweekopen coloured(100,149,237) as "Week Open", myweekhigh coloured(0,128,0) as "Week High", myweeklow coloured(128,0,0) as "Week Low", myweekclose coloured(0,0,255) as "Week Close", mymonthopen coloured(100,149,237) as "Month Open", mymonthhigh coloured (0,128,0) as "Month High", mymonthlow coloured (128,0,0) as "Month Low", mymonthclose coloured (0,0,255) as "Month Close",mydayopen coloured(100,149,237) as "Day Open", mydayhigh coloured (0,128,0) as "Day High", mydaylow coloured (128,0,0) as "Day Low", mydayclose coloured (0,0,255) as "Day Close", myyearopen coloured(100,149,237) as "Year Open", myyearhigh coloured (0,128,0) as "Year High", myyearlow coloured (128,0,0) as "Year Low", myyearclose coloured (0,0,255) as "Year Close", myquarteropen coloured(100,149,237) as "Quarter Open", myquarterhigh coloured (0,128,0) as "Quarter High", myquarterlow coloured (128,0,0) as "Quarter Low", myquarterclose coloured (0,0,255) as "Quarter Close", myh4open coloured(100,149,237) as "H4 Open", myh4high coloured (0,128,0) as "H4 High", myh4low coloured (128,0,0) as "H4 Low", myh4close coloured (0,0,255) as "H4 Close", myh1open coloured(100,149,237) as "H1 Open", myh1high coloured (0,128,0) as "H1 High", myh1low coloured (128,0,0) as "H1 Low", myh1close coloured (0,0,255) as "H1 Close"