

Most Active Hours and Months
I have updated and I hope improved the indicator originally created by throwaway200 that can be found here:
https://www.prorealcode.com/prorealtime-indicators/active-hours-trading-indicator/
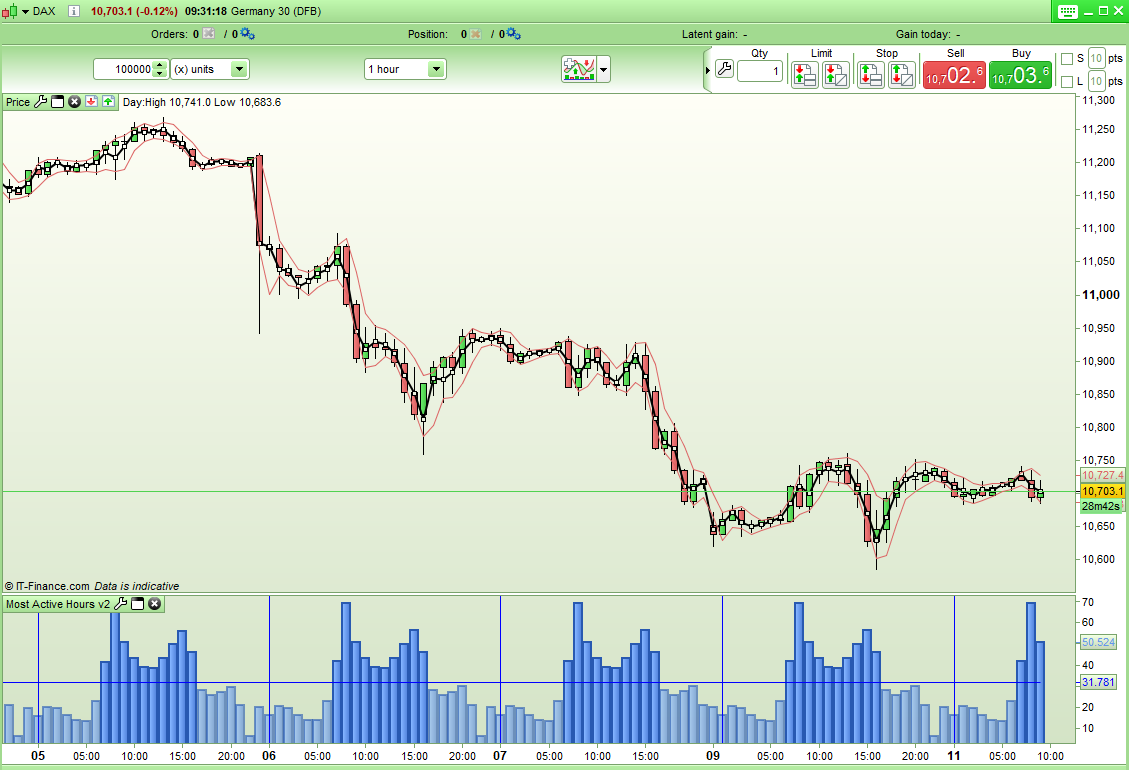
I have improved the graphical output so as to make it easier to see which hours are the most active on any market. I have also converted the same code into a separate indicator to analyse which are the most active months.
The bar chart under each hour/month shows the all time average for that particular hour or month. There is also an all time all hours/ all months average line. Any hour/month whose average is above the all time average is highlighted by a darker bar so that it can be easily seen which are the most active hours/months to trade. The start of a new day/ new year is highlighted by a vertical line through the first hour of the day or through January.
There are two separate indicators to upload or copy. One for hourly analysis and one for monthly analysis. Apply the hourly one only to the hourly chart and the monthly one only to the monthly chart.
Thanks to throwaway200 for the original idea.
Here is the Most Active Hours code:
//Most Active Hours
//By Vonasi (thanks to throwaway200 for the idea)
//20181211

//defparam calculateonlastbars = 1000

IF openhour = 0 THEN
H0 = (H0 + (High - Low))
H0Count = (H0Count + 1)
ThisHour = (H0 / H0Count)
drawvline(barindex) coloured(0,0,255)
ELSIF openhour = 1 THEN
H1 = (H1 + (High - Low))
H1Count = (H1Count + 1)
ThisHour = (H1 / H1Count)
ELSIF openhour = 2 THEN
H2 = (H2 + (High - Low))
H2Count = (H2Count + 1)
ThisHour = (H2 / H2Count)
ELSIF openhour = 3 THEN
H3 = (H3 + (High - Low))
H3Count = (H3Count + 1)
ThisHour = (H3 / H3Count)
ELSIF openhour = 4 THEN
H4 = (H4 + (High - Low))
H4Count = (H4Count + 1)
ThisHour = (H4 / H4Count)
ELSIF openhour = 5 THEN
H5 = (H5 + (High - Low))
H5Count = (H5Count + 1)
ThisHour = (H5 / H5Count)
ELSIF openhour = 6 THEN
H6 = (H6 + (High - Low))
H6Count = (H6Count + 1)
ThisHour = (H6 / H6Count)
ELSIF openhour = 7 THEN
H7 = (H7 + (High - Low))
H7Count = (H7Count + 1)
ThisHour = (H7 / H7Count)
ELSIF openhour = 8 THEN
H8 = (H8 + (High - Low))
H8Count = (H8Count + 1)
ThisHour = (H8 / H8Count)
ELSIF openhour = 9 THEN
H9 = (H9 + (High - Low))
H9Count = (H9Count + 1)
ThisHour = (H9 / H9Count)
ELSIF openhour = 10 THEN
H10 = (H10 + (High - Low))
H10Count = (H10Count + 1)
ThisHour = (H10 / H10Count)
ELSIF openhour = 11 THEN
H11 = (H11 + (High - Low))
H11Count = (H11Count + 1)
ThisHour = (H11 / H11Count)
ELSIF openhour = 12 THEN
H12 = (H12 + (High - Low))
H12Count = (H12Count + 1)
ThisHour = (H12 / H12Count)
ELSIF openhour = 13 THEN
H13 = (H13 + (High - Low))
H13Count = (H13Count + 1)
ThisHour = (H13 / H13Count)
ELSIF openhour = 14 THEN
H14 = (H14 + (High - Low))
H14Count = (H14Count + 1)
ThisHour = (H14 / H14Count)
ELSIF openhour = 15 THEN
H15 = (H15 + (High - Low))
H15Count = (H15Count + 1)
ThisHour = (H15 / H15Count)
ELSIF openhour = 16 THEN
H16 = (H16 + (High - Low))
H16Count = (H16Count + 1)
ThisHour = (H16 / H16Count)
ELSIF openhour = 17 THEN
H17 = (H17 + (High - Low))
H17Count = (H17Count + 1)
ThisHour = (H17 / H17Count)
ELSIF openhour = 18 THEN
H18 = (H18 + (High - Low))
H18Count = (H18Count + 1)
ThisHour = (H18 / H18Count)
ELSIF openhour = 19 THEN
H19 = (H19 + (High - Low))
H19Count = (H19Count + 1)
ThisHour = (H19 / H19Count)
ELSIF openhour = 20 THEN
H20 = (H20 + (High - Low))
H20Count = (H20Count + 1)
ThisHour = (H20 / H20Count)
ELSIF openhour = 21 THEN
H21 = (H21 + (High - Low))
H21Count = (H21Count + 1)
ThisHour = (H21 / H21Count)
ELSIF openhour = 22 THEN
H22 = (H22 + (High - Low))
H22Count = (H22Count + 1)
ThisHour = (H22 / H22Count)
ELSIF openhour = 23 THEN
H23 = (H23 + (High - Low))
H23Count = (H23Count + 1)
ThisHour = (H23 / H23Count)
ENDIF

avg = (h0 + h1 + h2 + h3 + h4 + h5 + h6 + h7 + h8 + h9 + h10 + h11 + h12 + h13 + h14 + h15 + h16 + h17 + h18 + h19 + h20 + h21 + h22 + h23)/(h0count + h1count + h2count + h3count + h4count + h5count + h6count + h7count + h8count + h9count + h10count + h11count + h12count + h13count + h14count + h15count + h16count + h17count + h18count + h19count + h20count + h21count + h22count + h23count)

c = 155
if ThisHour > Avg then
c = 255
endif

RETURN thishour coloured (100,149,237,c) style(histogram, 2) as "Average Range", avg coloured(0,0,255) style(line,1) as "All Time Average"
Here is the Most Active Months code:
//Most Active Monthss
//By Vonasi (thanks to throwaway200 for the idea)
//20181211

//defparam calculateonlastbars = 1000

IF openmonth = 1 THEN
H1 = (H1 + (High - Low))
H1Count = (H1Count + 1)
ThisMonth = (H1 / H1Count)
drawvline(barindex) coloured(0,0,255)
ELSIF openmonth = 2 THEN
H2 = (H2 + (High - Low))
H2Count = (H2Count + 1)
ThisMonth = (H2 / H2Count)
ELSIF openmonth = 3 THEN
H3 = (H3 + (High - Low))
H3Count = (H3Count + 1)
ThisMonth = (H3 / H3Count)
ELSIF openmonth = 4 THEN
H4 = (H4 + (High - Low))
H4Count = (H4Count + 1)
ThisMonth = (H4 / H4Count)
ELSIF openmonth = 5 THEN
H5 = (H5 + (High - Low))
H5Count = (H5Count + 1)
ThisMonth = (H5 / H5Count)
ELSIF openmonth = 6 THEN
H6 = (H6 + (High - Low))
H6Count = (H6Count + 1)
ThisMonth = (H6 / H6Count)
ELSIF openmonth = 7 THEN
H7 = (H7 + (High - Low))
H7Count = (H7Count + 1)
ThisMonth = (H7 / H7Count)
ELSIF openmonth = 8 THEN
H8 = (H8 + (High - Low))
H8Count = (H8Count + 1)
ThisMonth = (H8 / H8Count)
ELSIF openmonth = 9 THEN
H9 = (H9 + (High - Low))
H9Count = (H9Count + 1)
ThisMonth = (H9 / H9Count)
ELSIF openmonth = 10 THEN
H10 = (H10 + (High - Low))
H10Count = (H10Count + 1)
ThisMonth = (H10 / H10Count)
ELSIF openmonth = 11 THEN
H11 = (H11 + (High - Low))
H11Count = (H11Count + 1)
ThisMonth = (H11 / H11Count)
ELSIF openmonth = 12 THEN
H12 = (H12 + (High - Low))
H12Count = (H12Count + 1)
ThisMonth = (H12 / H12Count)
ENDIF

avg = (h1 + h2 + h3 + h4 + h5 + h6 + h7 + h8 + h9 + h10 + h11 + h12)/(h1count + h2count + h3count + h4count + h5count + h6count + h7count + h8count + h9count + h10count + h11count + h12count)

c = 155
if ThisMonth > Avg then
c = 255
endif

RETURN ThisMonth coloured (100,149,237,c) style(histogram, 2) as "Average Range", avg coloured(0,0,255) style(line,1) as "All Time Average"