El’s Better Volume

El’s Better Volume

Hi all

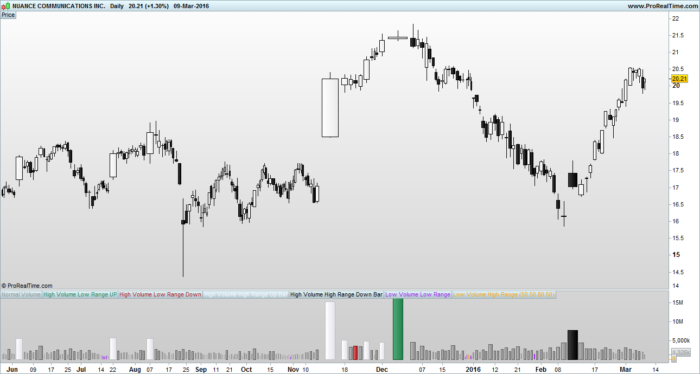
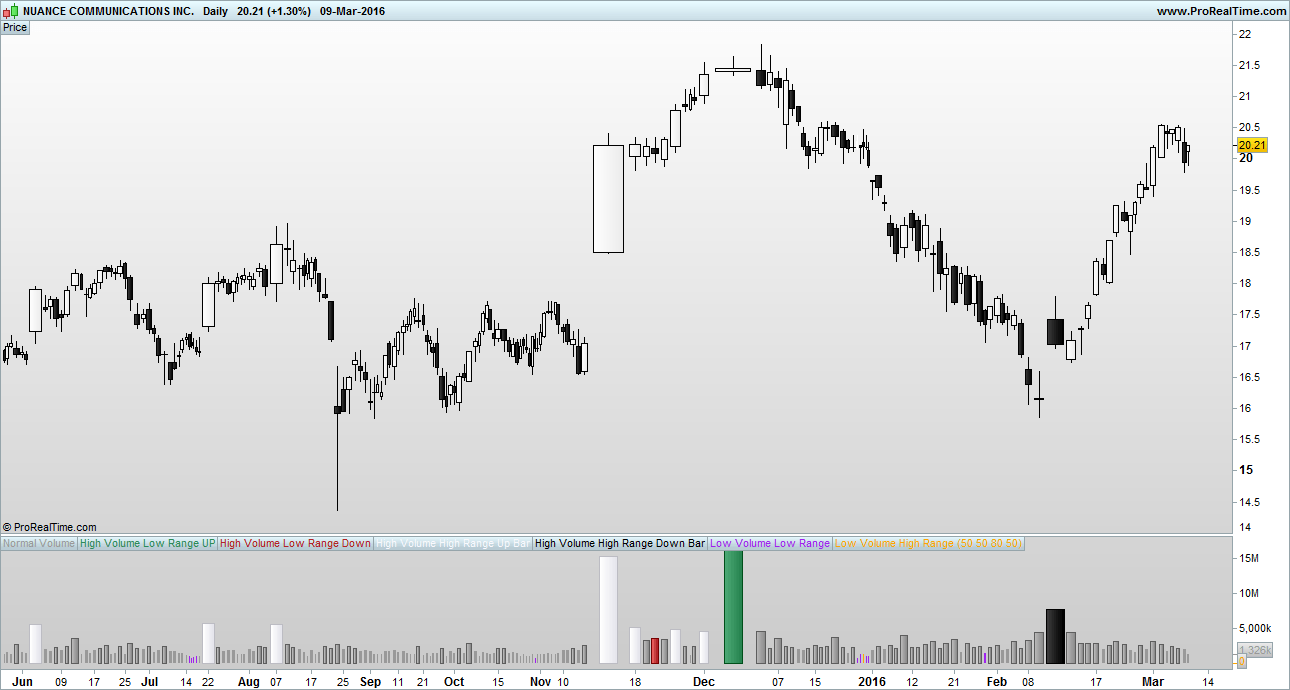
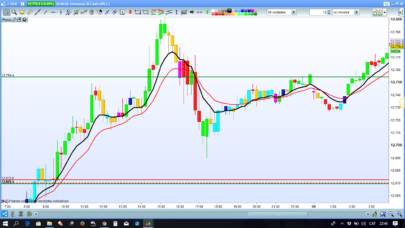
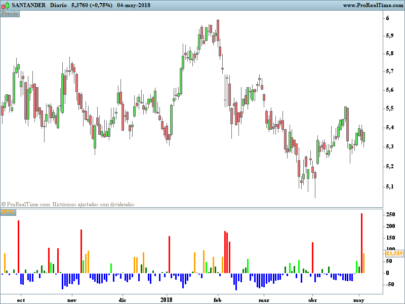
Thought id share my Better Volume indicator to contribute something to the site 🙂 this is my solution to a problem as i felt other better volume indicators out there were over complicating the problem. I used a few MA’s and the built in RANGE() to clean it up.

A link about ‘Better Volume’ and how to interpret it…
http://emini-watch.com/free-stuff/volume-indicator/

You may need to change the colours around for better visability on your background. Feel free to mod it asyou like.

El

Share this

Risk disclosure:

No information on this site is investment advice or a solicitation to buy or sell any financial instrument. Past performance is not indicative of future results. Trading may expose you to risk of loss greater than your deposits and is only suitable for experienced investors who have sufficient financial means to bear such risk.

ProRealTime ITF files and other attachments : How to import ITF files into ProRealTime platform?

PRC is also on YouTube, subscribe to our channel for exclusive content and tutorials

  1. Tarquin • 03/10/2016 #

    Hi,
    Thanks for posting this, I downloaded your first version of Better Volume and it works really well. So I tried loading your second version when I saw the link and although the file is described as my-better-volume-2.itf it only downloads as my-better-volume-1.itf. Am I doing something wrong, or is it possible the link on your post contains the previous file and not the new one?
    Kind Regards,
    Tony

  2. El Chupacabra • 03/10/2016 #

    Hi Tony, just seen your message. TBH I haven’t made a version 2!, maybe the moderator has done? Its a bit of a funny system on here you cant just add your own indicators and stuff without it going through a moderator first. Here is the code im using mate, keep it simple :)….
    // Variables to add:
    // Label in Program = \"vMA\", Label in properties window = \"Volume Moving Average\", Type = int, Default = \"50\"
    // Label in Program = \"vPercentLower\", Label in properties window = \"Low Volume %\", Type = int, Default = \"50\"
    // Label in Program = \"vPercentHigerr\", Label in properties window = \"High Volume %\", Type = int, Default = \"80\"
    // Label in Program = \"BarRanger\", Label in properties window = \"Bar Range\", Type = int, Default = \"50\"

    //Change all indicator styles to \"Histogram\" apart from teh two volume moving averages : LowVolume, HighVolume ..... keep them as lines or make them invisable

    VolumeMA = Average[vMA](VOLUME)

    LowVolume = (VolumeMA - ((VolumeMA * vPercentLower) / 100))
    HighVolume = (VolumeMA + ((VolumeMA * vPercentHigher) / 100))

    Vol = VOLUME
    ONCE HVLRU = 0
    ONCE HVLRD = 0
    ONCE HVHRU = 0
    ONCE HVHRD = 0
    ONCE LVLR = 0
    ONCE LVHR = 0

    c1 = VOLUME > HighVolume AND RANGE < Average[BarRange](RANGE) AND CLOSE > OPEN
    IF c1 THEN
    HVLRU = VOLUME
    Vol = 0
    ELSE
    HVLRU = 0
    ENDIF

    c2 = VOLUME > HighVolume AND RANGE < Average[BarRange](RANGE) AND CLOSE < OPEN
    IF c2 THEN
    HVLRD = VOLUME
    Vol = 0
    ELSE
    HVLRD = 0
    ENDIF

    c3 = VOLUME > HighVolume AND RANGE > Average[BarRange](RANGE) AND CLOSE > OPEN
    IF c3 THEN
    HVHRU = VOLUME
    Vol = 0
    ELSE
    HVHRU = 0
    ENDIF

    c4 = VOLUME > HighVolume AND RANGE > Average[BarRange](RANGE) AND CLOSE < OPEN
    IF c4 THEN
    HVHRD = VOLUME
    Vol = 0
    ELSE
    HVHRD = 0
    ENDIF

    c5 = VOLUME < LowVolume AND RANGE < Average[BarRange](RANGE)
    IF c5 THEN
    LVLR = VOLUME
    Vol = 0
    ELSE
    LVLR = 0
    ENDIF

    c6 = VOLUME < LowVolume AND RANGE > Average[BarRange](RANGE)
    IF c6 THEN
    LVHR = VOLUME
    Vol = 0
    ELSE
    LVHR = 0
    ENDIF

    RETURN Vol COLOURED (153,153,153) AS \"Normal Volume\", HVLRU COLOURED (46,139,87) AS \"High Volume Low Range UP\", HVLRD COLOURED (178,34,34) AS \"High Volume Low Range Down\", HVHRU COLOURED (248,248,255) AS \"High Volume High Range Up Bar\", HVHRD COLOURED (0,0,0) AS \"High Volume High Range Down Bar\", LVLR COLOURED (160,32,240) AS \"Low Volume Low Range\", LVHR COLOURED (255,165,0) AS \"Low Volume High Range\", HighVolume COLOURED (216,191,216) AS \"High Vol MA\", LowVolume COLOURED (216,191,216) AS \"Low Vol MA\"


avatar
Register or

Likes

avatar avatar avatar avatar avatar
Related users ' posts
Nicolas
8 years ago
enricot Scusa nn riesco.
SoloContado If you smooth the signal using a "summation" function, you get a nice "crossing of 0" graph....
ShaunG Greatly appreciated Nicolas!
Gianluca ok i fixed it i hope is ok like this: //TAC trader zone 10.2 | indicator //01.01.2018 //R...
TAC Bolsa Hello try this new version or view the blog with the new indicators .. https://www.t...
TAC Bolsa Sorry, TAC Trader Zone V2 https://www.tiburonesdealetacorta.com/2018/11/indicador-tac-tr...
AGTrader Interesante, muy visual Doc. Felicidades!!!
Andraxx simplemente impresionante Dom...te sigo en youtube. Me ha gustado tu canal. Gracias por comp...
TACBOLSA
8 years ago
luxrun Thank you so much Tac BOLSA, I can not post the picture tonight I'll try tomorrow. I loaded ...
TAC Bolsa A new version of TAC Volume HPI DIV10.4 is available. that marks the divergence In the fo...
Raymundo Buenas tardes. Como puedo descargar algunos indicadores de esta pagina ?
Ravindra Khanna copied it to pro real time not working. what to do?
rama I want to use this indicator in trading system, it says zig zag is obsolete and not supported
Nicolas Right, due to its repainting behavior, the zigzag is not allowed in automated trading with r...
rama I noticed it changes as time progress, I am 7 as the average, how many period it wont chang...
mangiaragni Buongiorno io non riesco a visualizzare nessun tipo di volume , mi torna sempre una linea dr...
Nicolas Assicurati che lo strumento che stai guardando abbia dei volumi! È il caso?
Nicolas Add it on price using the wrench on the left upper side of the price chart.
Stenozar thanks Nicolas, I' ll try again!
Radetzky Buongiono e grazie : l'immagine sopra ritrae l'indicatore sul TF 15 min ma a me funzio...
Steven Hi im looking for some help to put a automated code together BUY ORDER If EMA 10/25 is...
Dwell Thank you! Great tool!
ftrader8637 Any possibility to have this for multicharts. Sorry I am not a programer :-(
Nicolas Hi, we do not offer free assistance for other trading platform than ProRealTime. There is no...
MauroPro It is possible to apply this indicator ON the chart , because when I try to apply the formul...
Nicolas Yes, just apply it on the price chart by using the wrench on the left upper side of your pri...
MauroPro Hi Nicolas, thanks for the reply, I managed to apply the indicator on the chart.
Geronima Ortiz okay bien estaré pendiente en esta pagina gracias
Domenec Aqui dejo colgado link del video para ver como funciona el indicador https://www.youtube....
Geronima Ortiz Gracias Domenec
Juanjo Hola?. Exactamente cuál es su utilización?.
bolsatrilera Hola Juanjo, su principio esparecido a las bandas de Bollinguer.Las lineas de las bandas son...
Gordon101 Hi when I added your Guppy indicator to my chart it went below the chart beside the oscilla...
Nicolas Add it on the price by using the wrench located on the left upper side of your price chart.
Gordon101 Thanks Nicolas, worked a treat.
Geronima Ortiz I watched the video three times, but I can not put the npips parameter as a variable. I do...
Geronima Ortiz I think the video is for an old version of prorealtime, the images do not correspond at all ...
Nicolas indicator1 = CALL “PRC_StopReversal”[npips, 1] and define npips in the optimization window ...
Etienne Hi, thanks for proving this code. I would like to contribute by adding a computation speed...
Etienne //Compute Super Smoother coefficients once if barindex = 1 then a1 = exp( -1.414 * 3.14159...
Nicolas Thanks a lot!

Top