

CCI Correction.IND
March 9, 2018, 11:07 AM
Indicators
1 Comment
The original idea is:
use two CCI [26] one on a weekly timeframe and the other on a daily timeframe.
- When CCI [26] on the weekly timeframe exceeds level 100, there is an uptrend that lasts until the CCI falls below the -100 level.
- When CCI [26] on the weekly timeframe falls below the -100 level, there is a downtrend that lasts until the CCI rises above the 100 level.
At the same time a CCI [26] is used on a daily timeframe.
- When there is an uptrend and the CCI [26] on the daily timeframe falls below the level -100 there is a pull back. When CCI goes up above level zero, a long position is opened.
- When there is a downtrend and the CCI [26] on the daily timeframe rises above level 100 there is a pull back. When CCI returns below level zero, a short position is opened.
For more details see:
http://stockcharts.com/school/doku.php?id=chart_school:trading_strategies:cci_correction
Unlike the original idea, in this indicator two CCI are used, one of long period and the other of short period on the same timeframe.
Choose the “L” period for the long period CCI and the “C” period for the short period CCI.
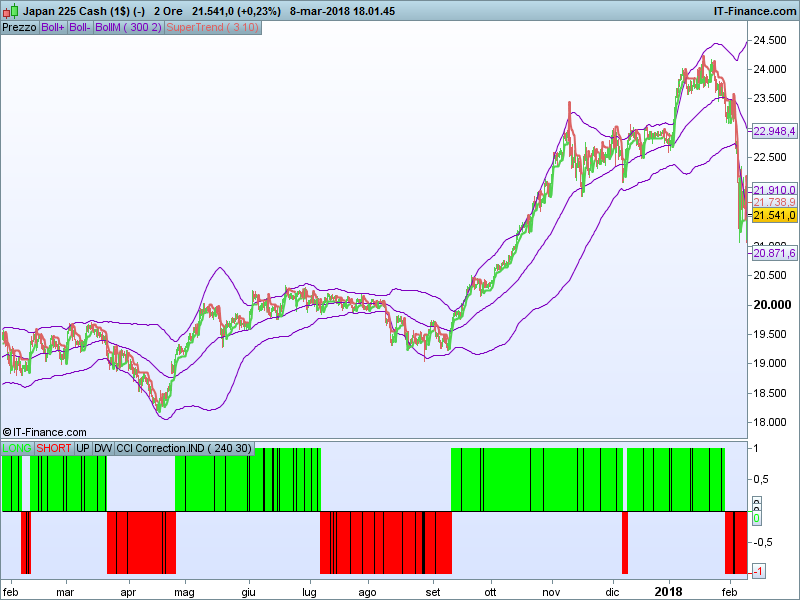
Set “LONG”, “SHORT”, “UP”, “DW” in histogram style.
The green histogram means that there is an uptrend
The red histogram means that there is a downtrend
The black histogram means that there is an entry signal.
L=130
B=26

CCL = CCI[L]
CCS = CCI[B]

IF CCL > 100 THEN
 LASTUP = 1
 LASTDW = 0
 UP = 0
 DW = 0
ENDIF
IF CCL < -100 THEN
 LASTDW = -1
 LASTUP = 0
 UP = 0
 DW = 0
ENDIF

IF CCS > 100 THEN
 BLASTUP = 1
 BLASTDW = 0
 UP = 0
ENDIF
IF CCS < -100 THEN
 BLASTDW = -1
 BLASTUP = 0
 DW = 0
ENDIF

IF LASTUP = 1 AND BLASTDW[1] = -1 THEN
 IF CCS[1]<0 AND CCS>0 THEN
  UP = 1
  DW = 0
 ELSE
  UP = 0
  DW = 0
 ENDIF
ENDIF

IF LASTDW = -1 AND BLASTUP[1] = 1 THEN
 IF CCS[1]>0 AND CCS<0 THEN
  DW = -1
  UP = 0
 ELSE
  DW = 0
  UP = 0
 ENDIF
ENDIF

Return LASTUP coloured (0,255,0) as "LONG", LASTDW coloured (255,0,0) as "SHORT",UP coloured (0,0,0) as "UP", DW coloured (0,0,0) as "DW",0
Download
Filename:
CCI-Correction.itf
Downloads:
465
Senior
Code artist, my biography is a blank page waiting to be scripted. Imagine a bio so awesome it hasn't been coded yet.
Author’s Profile
Loading...