John Ehlers, Correlation Trend Indicator, Stocks & Commodities Magazine (05/2020) :
“The basic idea of the Correlation Trend Indicator (CTI) is quite simple. The ideal trend curve is a straight upwards line. So the CTI just measures the correlation of the price curve with this ideal trend line.
X represents the price curve, Y the trend line, and correlation is measured with the Spearman algorithm. (As Nicolas pointed out it is in fact based on the R-squared correlation coefficient formula which is a statistical measure of how close data is fitted to a regression line).
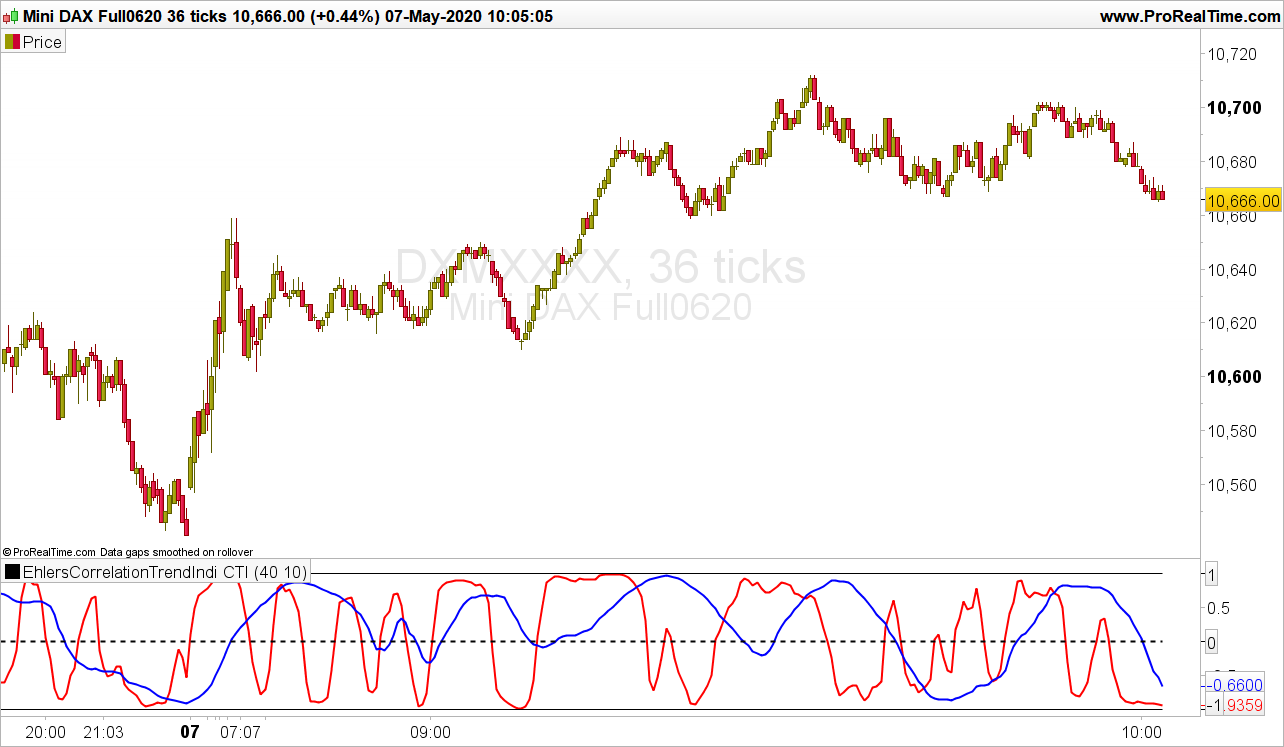
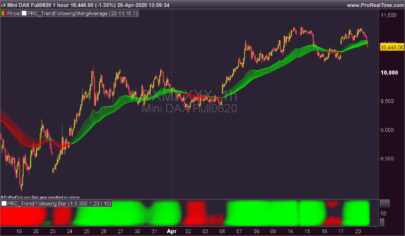
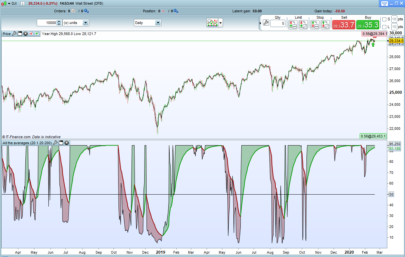
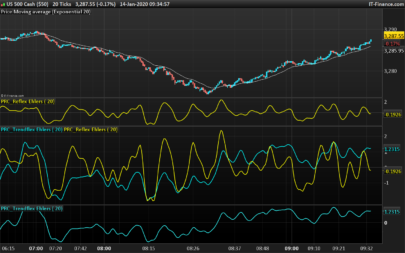
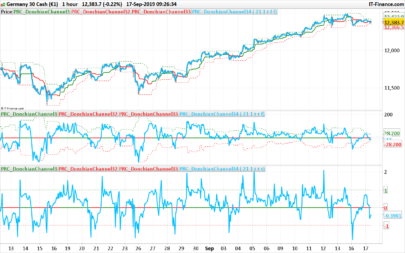
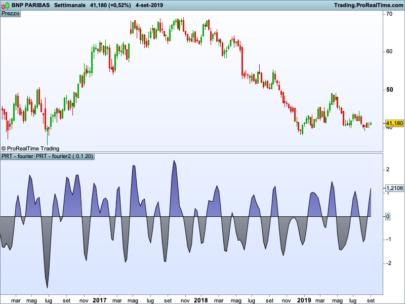
This is how the Correlation Trend Indicator (CTI) looks when applied to SPY (red = 10 days period, blue = 40 days).
We can see that the lines reproduce rather well the price curve trend. And we can also see that the blue line, the 40-days trend, is not just a smoothed version of the red 10-days trend – it looks entirely different. This is an interesting feature of a trend indicator – it separates long-term and short-term trend perfectly…”
The article goes on to mention that ‘trading on CTI crossovers would be difficult. A somewhat predictive power of the CTI(SPY,20) exists – but it is too weak for being directly exploited in a crossover trading system.'”
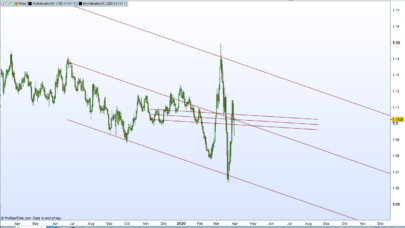
From my own analysis I’d be inclined to suggest that a relationship does exit that is not random. Please see the link below showing a system with a 5 and 10 day CTI crossover on mean reverting major currency pairs: https://www.prorealcode.com/topic/very-latest-ehlers-correlation-trend-indicator-2/#post-129552
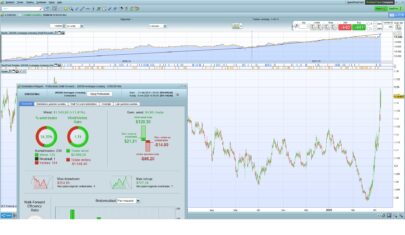
The system ITF code is in the very next comment after the link above. If time allows I will apply Machine Learning code to the CTI periods and the crossover thresholds. The current CTI system buys when the 5 day CTI crosses over the 10 day CTO when both values are below -0.5 threshold and vice versa for the short entry. Exits are provided by the Kase Dev Stop (v3).
|
1 2 3 4 5 6 7 8 9 10 11 12 13 14 15 16 17 18 19 20 21 22 23 24 25 26 27 28 29 30 31 32 33 34 35 36 37 38 39 40 41 42 43 44 45 46 47 48 49 50 51 52 53 54 55 56 57 58 59 60 61 62 63 64 |
//Ehler's Correlation Trend Indicator (CTI) //PRC_R-Squared coefficient | indicator //19.09.2018 //Updated to double Ehler's R2 03/05/2020 //Nicolas @ www.prorealcode.com //Sharing ProRealTime knowledge // --- settings LPeriod =40 //Add in Variables SPeriod =10 //Add in Variables // --- end of settings //LPeriod=40 //SPeriod=10 /////////////////////////////////////////////////////////////////////////////////////////////////// //Short SumSx = 0 // the price curve SumSy = 0 SumSxx = 0 SumSxy = 0 SumSyy = 0 // the trend line data=customclose for count = 0 to SPeriod-1 do X = Data[count] // the price curve Y = -count // the trend line SumSx = SumSx + X SumSy = SumSy + Y SumSxx = SumSxx + X*X SumSxy = SumSxy + X*Y SumSyy = SumSyy + Y*Y next if(SPeriod*SumSxx-SumSx*SumSx > 0 and SPeriod*SumSyy-SumSy*SumSy > 0) then CTIShort = (SPeriod*SumSxy-SumSx*SumSy)/Sqrt((SPeriod*SumSxx-SumSx*SumSx)*(SPeriod*SumSyy-SumSy*SumSy)) endif /////////////////////////////////////////////////////////////////////////////////////////////////// //Long SumLx = 0 SumLy = 0 SumLxx = 0 SumLxy = 0 SumLyy = 0 for count = 0 to LPeriod-1 do X = Data[count] // the price curve Y = -count // the trend line SumLx = SumLx + X SumLy = SumLy + Y SumLxx = SumLxx + X*X SumLxy = SumLxy + X*Y SumLyy = SumLyy + Y*Y next if(LPeriod*SumLxx-SumLx*SumLx > 0 and LPeriod*SumLyy-SumLy*SumLy > 0) then CTILong = (LPeriod*SumLxy-SumLx*SumLy)/Sqrt((LPeriod*SumLxx-SumLx*SumLx)*(LPeriod*SumLyy-SumLy*SumLy)) endif return CTIShort coloured (255,0,0) style (line,2) as "CTI Short R² Trend", CTILong coloured (0,0,255) style (line,2) as "CTI Long R² Trend", 0 style (dottedline,2)as "0", -1 as "-1", 1 as "1" |
Share this
No information on this site is investment advice or a solicitation to buy or sell any financial instrument. Past performance is not indicative of future results. Trading may expose you to risk of loss greater than your deposits and is only suitable for experienced investors who have sufficient financial means to bear such risk.
ProRealTime ITF files and other attachments :
Find other exclusive trading pro-tools on ![]()
PRC is also on YouTube, subscribe to our channel for exclusive content and tutorials