MBFX Timing v2

v10.3
MBFX Timing v2

The MBFX Timing indicator is a part of the well-known forex “MOSTAFA BELKHAYATE” system.

In fact, MBFX Timing indicator could be compared to a classic stochastic oscillator. It works on a similar principle.

How to trade with the MBFX Timing Indicator?
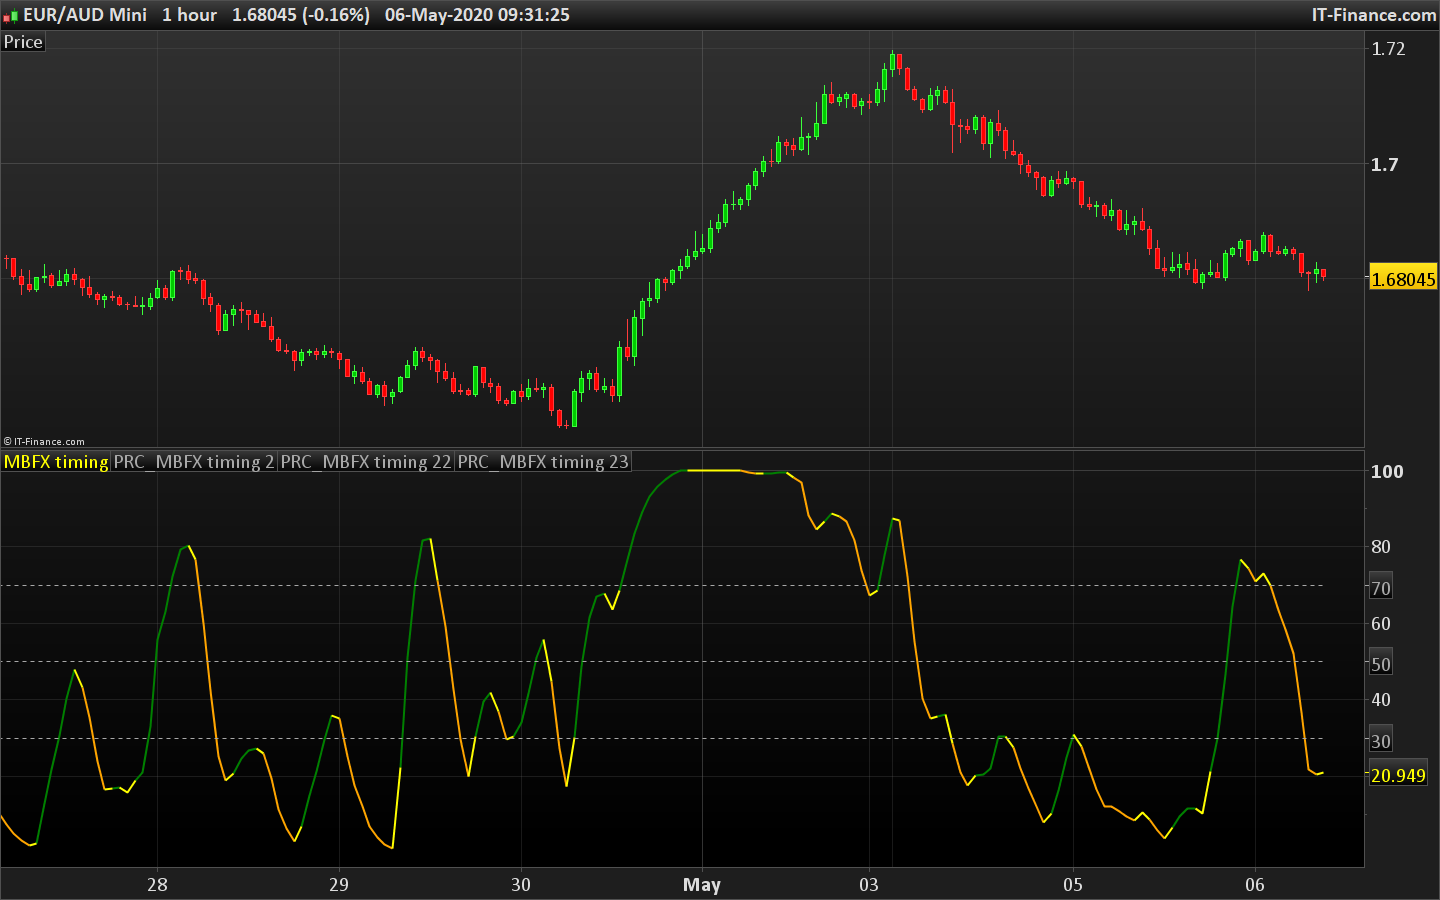
Look for BUY opportunities when:

MBFX Timing indicator reaches the oversold zone (low levels of the scale).
Late confirmation is line color change to yellow.
Look for SELL opportunities when:

MBFX Timing indicator reaches the overbought zone (high levels of the scale).
Late confirmation is line color change to yellow.

This version 2 seems to be the most comparable to the original strategy than the other older MBFX timing indicator version posted in the library. People would like to trade on the same principle than the Belkhayate system should use this one.


Share this

Risk disclosure:

No information on this site is investment advice or a solicitation to buy or sell any financial instrument. Past performance is not indicative of future results. Trading may expose you to risk of loss greater than your deposits and is only suitable for experienced investors who have sufficient financial means to bear such risk.

ProRealTime ITF files and other attachments : How to import ITF files into ProRealTime platform?

PRC is also on YouTube, subscribe to our channel for exclusive content and tutorials

  1. rama • 05/06/2020 #

    I have tested this indicator, this is most powerful indicator for trend trading. Len=1 , indicator 100 buy, indicator 0 sell. works well on 10 or 15 min. thanks for providing holy grail

  2. Fabian • 05/06/2020 #

    Hello rama,

    how do you come up with these parameters? Have you back-tested these?
    A visual test in the Dow Jones in the M10 shows me many false signals without considering other factors.

  3. rama • 05/06/2020 #

    you need set Len=1, check your stop loss if is 10 take only trades which fits into stop loss. when indicator is 100 buy

  4. rama • 05/06/2020 #

    yes every signal we should not take trade take only that fits into stop loss and risk reward criteria

  5. Bard • 05/06/2020 #

    Just an update to match the buy and sell lines to the original indicator:
    (code didn’t appear in Add PRT code Chrome browser?)

    return ld24 coloured(r,g,0) style(line,2) as “MBFX timing”, 10 coloured(0,255,0) style(dottedline,2) as “Buy Line 2”, 30 coloured(0,255,0) style(dottedline,2) as “Buy Line 1”, 50 coloured(100,100,100) style(dottedline,2) as “Mid Line”, 70 coloured(255, 0, 0) style(dottedline,2) as “Sell Line 1”, 90 coloured(255, 0, 0) style(dottedline,2) as “Sell Line 2”

  6. Bard • 05/06/2020 #

    Not optimised values. Simply tried Len = 5 (well 5 days in the week and all that).
    Buy on Cross Over of Buy Line 2 and Cross Under of Sell Line 2.
    Daily mean reverting currencies: USD/CHF, GBP/USD, USD/JPY, even the Dow (but not Dax, FTSE, Silver or Brent LCO). 2 yrs data.
    Spread = 4.
    Not bad. Low Drawdown too.
    eg: Dropbox USD/JPY,
    tiny.cc/ijdsoz
    Click “No thanks continue…”

  7. Bard • 05/06/2020 #

    Nice going Nicolas, It’s now like the original indicator with the colour coded signal line.

  8. Sofitech • 05/06/2020 #

    @rama could you tell use what do you trade and the fimeframe you use with Len=1 ? Would like to see why you can consider this as a holy grail. Thanks

  9. oraclus • 05/06/2020 #

    Bonjour auriez vous son équivalent sur Ninjatrader? Merci pour votre retour

  10. kbrooks323 • 05/06/2020 #

    Hello would someone be willing to release a scan code for this? that would be helpful as I sent out a programming request to support. When the oscillator is above 70 and is yellow for shorting and when the oscillator is below 30 and green for buying? Thanks.

    • Nicolas • 05/06/2020 #

      You can do easily this screener by using the assisted creation tool. It would take you about 5 minutes.

  11. kbrooks323 • 05/06/2020 #

    I just figured it out thanks!

avatar
Register or

Likes

avatar avatar avatar avatar avatar avatar avatar avatar avatar avatar
Related users ' posts
Fgats quelques explications en Français ici : Some explanations in French here : https://www.p...
Nicolas Merci pour cette contribution, j'apprécie ! :)
Fgats Merci Nicolas pour ces encouragements et merci aussi pour le commentaire en Anglais accompa...
Msport71 Thank You very much
KumoNoJuzza Bonjour, @rominet44 pourrais tu expliquer à quoi sert le filtre: M8=average[11](close) // ...
Nicolas la moyenne mobile 11 période actuelle est ascendante ou descendante, on teste sa valeur vis ...
Patrice210 bonjour STANKO, effectivement la première ligne apparait en anomalie et je ne comprend pas v...
Madrosat repainting as cog or not repainting?
Nicolas It doesn't repaint.
AntoGH Bonjour peut-on backtester cela ? Et si vous l'avez fait pourriez vous nous donner le code.....
Nicolas désolé c'est un oubli de ma part, tu peux supprimer cette ligne, elle n'est plus utile dans ...
DELBERT Bonjour , Nicolas , merci pour ta réponse , je suis en effet avec PRT 10.3 , et j'ai bidouil...
RakeshPoluri I have a question about the bands on the candles. Is it bollinger bands or something else?
Nicolas I think that's 2 Bollinger Bands
FernetTrader think i found a solution!
monochrome Thanks for the indicator. Very interesting!
monochrome Can you please share how you made it work? I cant seem to make it work in a strategy
Nicolas Merci d'ouvrir un sujet dans le forum des screeners en respectant les règles de publication ...
Pensera Bravo Nicolas ! Tu es en quelque sorte l’inventeur de Metascore…(oups je viens de lire jusqu...
Nicolas Dans un but d'investissement pure, et non spéculatif.
Nicolas c'est exactement ce que je fais entre les lignes 58 et 64 pour pouvoir tracer la ligne complète
Italo Fabian Nicolas, Ces matrices sont-elles des vecteurs unidimensionnels ou multidimensionnels? Depu...
Denis Bonjour Nicolas et RicLg, Merci Nicolas pour cet indicateur intéressant et merci RicLg pour...
superfalcio Hello, on the 2h timeframe I got a better performance in terms of win% and profit factor. I ...
Jiankyr82 Juan thanks for sharing, I had played with it few days, as also try to catch up on my pro-re...
Lespa212 Hi Samsampop, are you using this strategy? did you add a SL and an exit in case of a trend ...
woktrade Superbe !
Vonasi An updated version with a bug fix can be found here: https://www.prorealcode.com/topic/dis...
snucke hey Vonasi is it possible you can help me get this indicator to show how much a market mo...
Vinks_o_7 Vonasi you're a beast !!! ;-)))
pableitor Amazing indicator , you are pushing PRT to the limit! But looking at the scatter its not c...
Vinks_o_7 Thanks Doc !
Maxime Baudin Intresting, thank you!
Nicolas
4 years ago
KDJ
KDJ
3
Indicators
fireleg79 Bonsoir Nicolas. Merci pour tout ton travail. Quand tu auras le temps pourras-tu jeter un oe...
Sejibi Bonsoir, En remplaçant percentJ = 3 * percentD - 2 * percentK par percentJ = 3 * perc...
JMARTY Bonjour, A la recherche d'un indicateur détectant les divergences sur DMI, je tombe sur ce...
Jan Wind Thanks for sharing ! The Gain/Loss ratio is a bit low, 1,16, hardly offset the risks take...
drive whats the period ?
Lucas0000 Hola. estoy buscando un programador en proorder, para hacer un programa basado en el Q-trend...
Sapo Thank you very much. as always your indicators are extremely effective. kind regards Vonasi.
mitsu21 Hi, it looks nice. I'll try it tomorrow thank you for your share kind regards bruno
kj1988 Thank you Vonasi for sharing this indicator. Very useful as a comfirmation to the price act...
michaelben Bonjour Nicolas . Je cherche une strategie pour faire du trading automatisé. J'ai essaye ave...

Top