This indicator is based on volume analysis such as the one already posted here: ZigZag Cumulative Volume
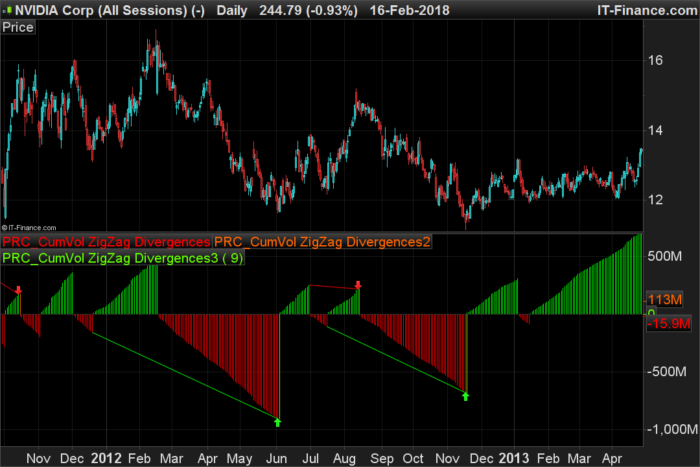
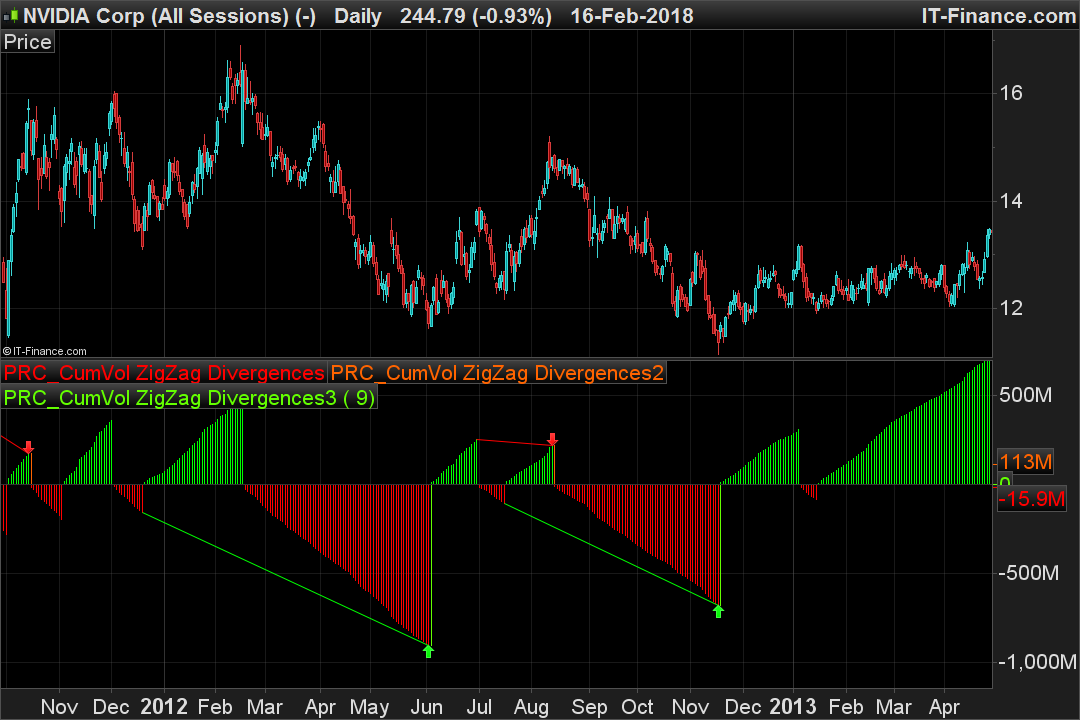
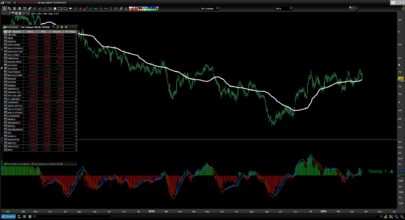
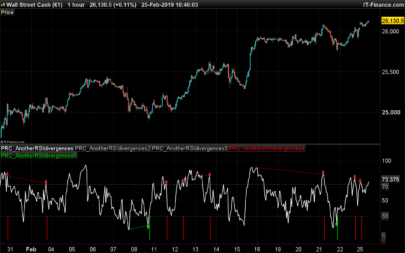
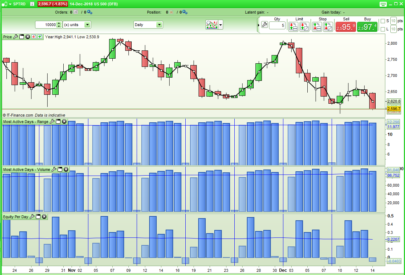
In this version, bullish and bearish divergences are identified according to the volume accumulation and distribution waves in relation to the price.
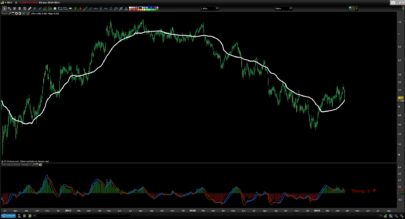
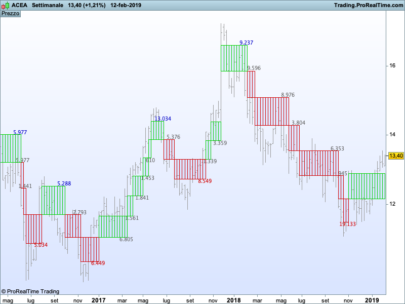
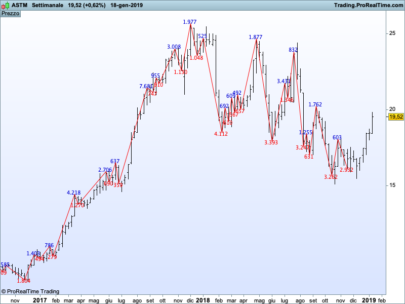
The waves are calculated using the ZigZag indicator included in the platform.
- Bearish divergence: if the volumes decline between 2 successive waves and the price increases (makes a new high), then a divergence would announce a possible lowering of the price.
- Bullish divergence: if the volumes decline between two successive waves and the price decreases (makes a new low), then a divergence would announce a possible price increase.
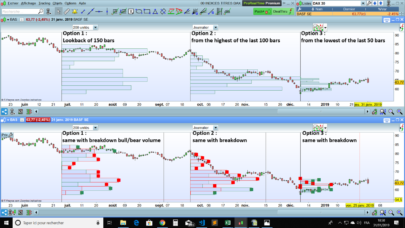
The ZigZag waves are adaptable with their validation percentage in the indicator settings or in the code (default is 3%). It will of course be necessary to modify this value according to the instrument and the timeframe used.
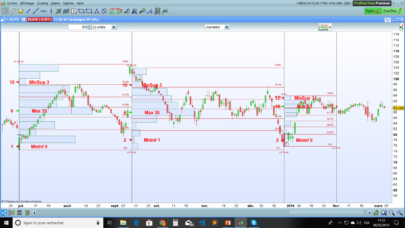
Divergences are plotted on the indicator using segments between successive waves and red and green arrows.
Due to its natural behavior, the ZigZag indicator will retrace itself if a new higher or lower is found. As a result, the latest information in the chart may not be completely frozen in real time. On the other hand, in the case of the history of the price graph, the discrepancy information will always be indicated with the last known information which does not necessarily appear on the current bar, but afterwards when the highest or the lowest has has been validated.
Original idea of this indicator came from this French topic: Cumulative Volume Zig Zag – Divergences
|
1 2 3 4 5 6 7 8 9 10 11 12 13 14 15 16 17 18 19 20 21 22 23 24 25 26 27 28 29 30 31 32 33 34 35 36 37 38 39 40 41 42 43 44 45 46 47 48 49 50 51 52 53 54 55 56 57 58 59 60 61 62 63 64 65 66 67 68 69 70 71 72 |
//PRC_CumVol ZigZag Divergences | indicator //14.02.2018 //Nicolas @ www.prorealcode.com //Sharing ProRealTime knowledge // --- parameters percentVariation = 3 zz = ZigZag[percentVariation](close) peak = zz<zz[1] and zz[1]>zz[2] tough = zz>zz[1] and zz[1]<zz[2] if color=1 then cumV = cumV+volume else cumV = cumV-volume endif if peak then lastpeakvol = peakvol lastpeakhigh = peakhigh lastpeakbar = peakbar peakvol = cumV[1] peakhigh = high[1] peakbar = barindex[1] cumV = -Volume color = -1 r=255 g=0 elsif tough then lasttoughvol = toughvol lasttoughlow = toughlow lasttoughbar = toughbar toughvol = cumV[1] toughlow = low[1] toughbar = barindex[1] cumV = Volume color = 1 r=0 g=255 endif //divergences finder divbear=0 divbull=0 //bearish divergence if(peak) then if peakhigh>lastpeakhigh and peakvol<lastpeakvol then divbear = peakvol drawsegment(lastpeakbar,lastpeakvol,peakbar,peakvol) coloured(r,g,0) drawarrowdown(peakbar,peakvol) coloured(r,g,0) endif endif //bullish divergence if(tough) then if toughlow<lasttoughlow and toughvol<lasttoughvol then divbull = toughvol drawsegment(lasttoughbar,lasttoughvol,toughbar,toughvol) coloured(r,g,0) drawarrowup(toughbar,toughvol) coloured(r,g,0) endif endif return cumV coloured(r,g,0) style(histogram), divbear coloured(255,100,0) style(histogram), divbull coloured(100,255,0) style(histogram) |
Share this
No information on this site is investment advice or a solicitation to buy or sell any financial instrument. Past performance is not indicative of future results. Trading may expose you to risk of loss greater than your deposits and is only suitable for experienced investors who have sufficient financial means to bear such risk.
ProRealTime ITF files and other attachments :
Find other exclusive trading pro-tools on ![]()
PRC is also on YouTube, subscribe to our channel for exclusive content and tutorials


Merci Nicolas.
Il y a une petite erreur de rien du tout.
Tu as mentionné deux fois “//bearish divergence” dans les commentaires. Il manque juste “//bullish divergence” pour la condition “tough”. 🙂
Merci j’ai corrigé 😉
Hello Nicolas, the indicator volume at price level, can I fade in the right of the chart?
What do you mean?
Ciao Nicolas complimenti per l’indicatore è veramente ottimo utilizzarlo assieme l’analisi tecnica.
the indicator “volume at price level” is shown on the left side of the chart, I want to have it on the right,
Well, why not, but it has nothing to deal with this post? and I don’t think that’s possible sorry.
Bonjour Nicolas,
Auriez-vous créé un backtest d’une stratégie long short avec cet indicateur ?
Par ailleurs, comment vous joindre en MP ?
Bien à vous,
Chris
I didn’t code any strategy with this indicator. You can contact me with the form of the contact page.
great indicator but repainting
That’s obvious with zigzag 🙂
Hi Nicolas, I’ve been trying to add a dynamic parameter for the “percentVariation”, using the video on this subject but I can’t get it working. Could you help please?
I can’t help publicly since it is included in the paid learning videos.
Which video please?
Sorry I don’t understand. I just watched the video without paying.
“Adding dynamic parameters to your indicators” – on Youtube.
Well I got it working eventually! Instead of [x] I used (x) as the variable. The video may need updating.
Bonjour. Magnifique indicateur, d’un coup d’œil et de le tester dans plusieurs valeurs ne manque aucun signal. Ce que je dois savoir, c’est si l’indicateur repeindre. Autrement dit, si le signal peut être donné pour acheter ou vendre et le lendemain, le signal disparaît?
Merci beaucoup et excellent travail.
Oui en effet, basé sur le zigzag, ce comportement est normal.
HI Nicolas! Thanks for the great work you’re putting into this forum! I have a question – This works great as an indicator, but I’d like to use it for screening potential buys/sells as well. Importing your code into ProScreener doesn’t work because of this section…Do you know haw to fix this?
drawsegment(lastpeakbar,lastpeakvol,peakbar,peakvol) coloured(r,g,0)
drawarrowdown(peakbar,peakvol) coloured(r,g,0)
endif”
Best Regards
Chris/Sweden
These 2 instructions are not allowed in ProScreener, just delete them. They are only there to plot things on chart, it will not affect the divergences finding of the main code.
Super! Thanks for the quick reply – And please keep up the good work! I’m learning a lot! All the best!// Chris
As I wrote, thanks for the help. Did’t work in the ProScreener – unable to just delete what you wrote – Then, new problems appears. I guess this code isn’t written as a screener, just an indicator. Would be nice to have it compatible to the screener, since your zigzag indicator looks promising…Is it possible to wish for that?I guess you are a busy man, but now you know ;)! Thanks and all the best! Chris
Nicolas, I’d like to add a condition to the code, namely internal bar strength (IBS) < x.
I tried this, but something isn't right with my syntax. Could you suggest a fix please?
IBS = ( (Close – Low) / (High – Low))*100
if(peak) then
if peakhigh>lastpeakhigh and peakvol<lastpeakvol and IBS<20 then
endif
endif
Seems I can’t edit or delete any post which has errors, like the above. Try again!
ibs = ( (Close – Low) / (High – Low))*100
if(peak) then
if peakvol>lastpeakvol and ibs<(ibsPK) then
resistance = high[1]
endif
endif
Please ask questions regarding codes in forums. Thank you.
i have only one request . Can u help to make the code compatible with amibroker ?
Sorry but this website deals only with the ProRealTime trading platform programming.
https://www.prorealcode.com/PRT-TRADING-english/
Ciao Nicolas! Perdonami, ma come si fa a estendere il periodo dell’indicatore a 100 000 unità? Purtroppo lo vedo solo fino a 10 000 dopo di che è tutto nero. Grazie mille!
No ok ho risolto! Grazie 🙂
Ciao a tutti e a NIcolas,
vpoichè con lo zigzag non è attendibile l’ultima barra (visto che il giorno dopo può cambiare) chiedo se vedendo le ultime due barre il segnale è attendibile, spero di essermi spiegato
grazie
bonjour Nicolas. serait t’il possible de le coder en screener. je ne s’ai pas faire. merci
Je le retrouve très rapidement dans notre forum: https://www.prorealcode.com/topic/cumulative-volumes-zigzag-divergences-pro-screener/
merci, j ai essayer mais erreur, il me dit la fonction prc n existe pas ?
“PRC_CumVol ZigZag Divergences”, c’est le nom de cet indicateur, il doit être présent dans la plateforme et sous ce même nom. Sinon un message d’erreur apparaît et c’est ce qu’il se passe dans ton cas.
Bonjour,
Je ne trouve pas le screener permettant d’afficher les actions qui montrent une flèche rouge ou verte sur le zigzag.
J’ai pourtant cherché dans la librairie et vu votre lien mais rien qui fait ressortir cet indicateur en screener.
Pourriez-vous me fournir le lien SVP ?
Bonne année à tous !
question posée et répondue 2 messages plus haut:
Je le retrouve très rapidement dans notre forum: https://www.prorealcode.com/topic/cumulative-volumes-zigzag-divergences-pro-screener/
Bonjour et merci beaucoup Nicolas
J’avais identifié et testé le code en question
Mais, le code du screener étant tellement différent de celui de l’indicateur et ne comprenant pas l’italien,
j’en ai déduit que le screener fourni répondait à une autre question.
Et il retournait trop de résultats (1060 actions).
sans critère de filtre (flèche achat / flèche vente apparue en date t ou en t-1 ou t-2).
Ou bien je n’ai peut être pas bien saisi l’utilité ou l’utilisation de l’indicateur et/ou du screener?
Cordialement
Ce sujet en Français et plus complet devrait t’intéresser. A noter que l’historique de ProScreener est limité à 255 bars et que les calculs commenceront donc à partir de ce moment alors que sur l’affichage graphique de l’indicateur, ils pourraient commencer beaucoup plus tôt, dépendant de la quantité d’unités affichées. Donc des différences seraient observables et par conséquent une incompréhension vis-à-vis du screener.
Hellow
I would like to make screener that will show me the change from red to green and from green to red
I’m almost sure that it has already been coded in a topic in one of the forums.
Bonjour Nicolas, je suis tombé sur cet indicateur qui est très intéressant mais n’y -a-t il pas une erreur pour les divergences haussières? En tendance baissière, l’indicateur devrait signaler une divergence haussière lorsque le prix établit un nouveau plus bas, et que le volume cumulé est inférieur à la précédente vague baissière. Or l’indicateur indique une divergence lorsque la nouvelle vague est supérieure en volume! Cela n’est pas logique à mon sens. Serait-il possible de rectifier? Ou bien il y a peut-être quelque chose qui m’échappe?!
Je pense que tu trouveras les explications à ce sujet et le pourquoi / comment ici : https://www.prorealcode.com/topic/cumulative-volume-zig-zag-divergences/
Hi All,
I run in to a problem with this indicator. The problem is that when you restart the proRealtime system it shows different values. I used 1 minute bars on the Daxx Future for 1 day period.
Because of the redrawing (repainting) nature of the zigzag indicator. It doesn’t give the same values in real time than on Closed bars (when the history is read).
Hello Nicolas, sorry for this dummy question, but what does express the orange ‘square’ on the chart? Thanks
I don’t know what you are talking about, this code doesnt plot anything on the price chart.
Thank you all for your contributions this is a great submission. Thanks for your inputs.
Bonjour nicolas. Je ne parviens pas à recopier le screener de l’indicateur. Auriez vous la gentillesse d’attache le fichier itf du screen ? merci nicolas
Quel screener svp? C’est dans un des sujets du forum? Merci de fournir le lien.