Genesis Matrix Trading

v10.3
Genesis Matrix Trading

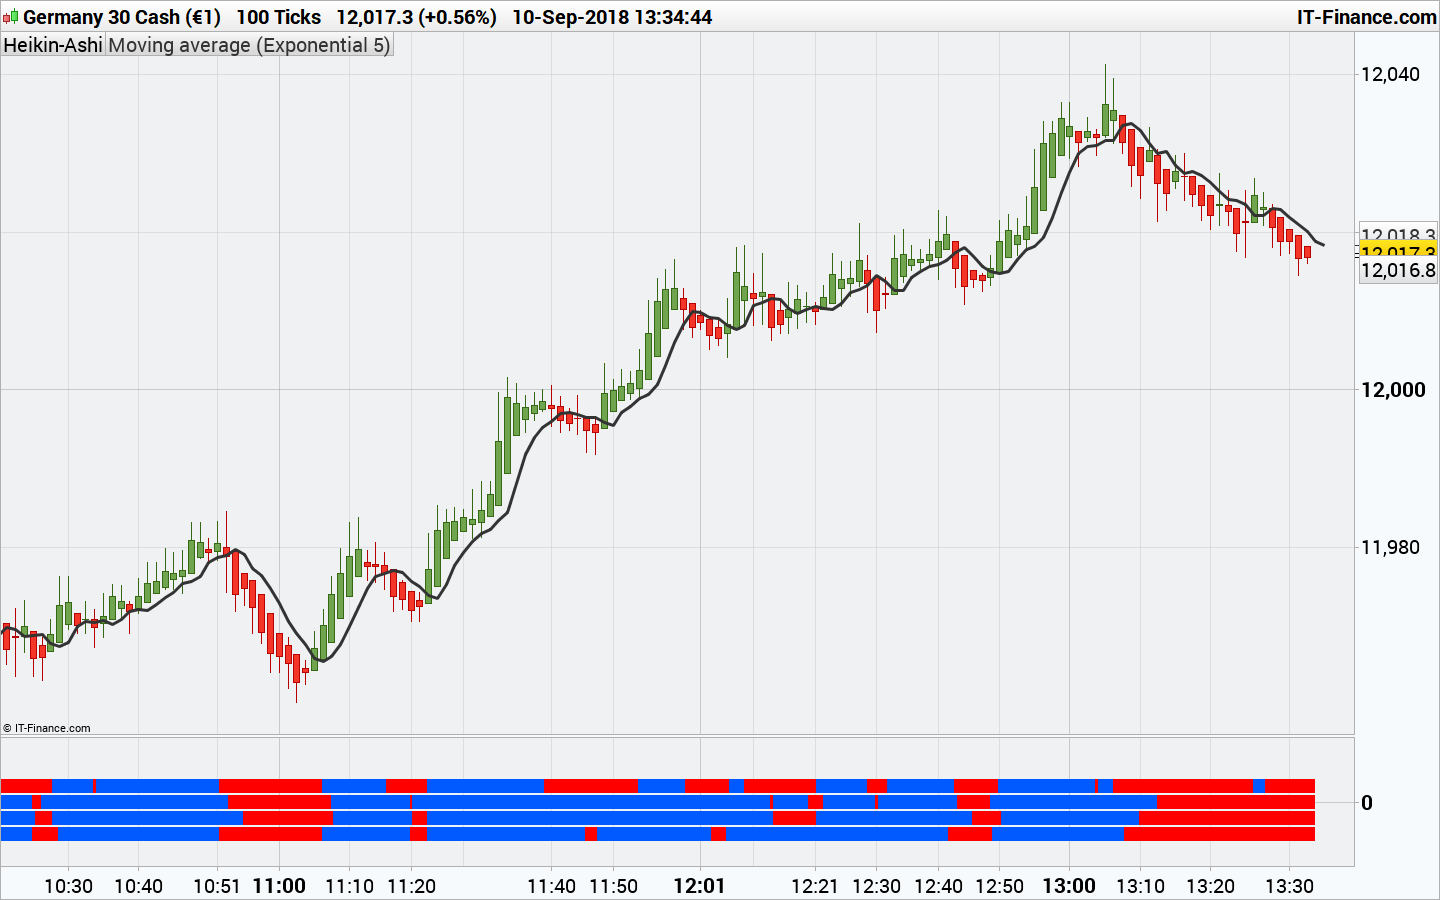
This indicator is a dashboard for the Genesis Matrix trading system. The 4 dots represents (from top to bottom):

  • The TVI (Ticks Volumes Indicator) slope (ascending or descending = blue or red)
  • CCI above or below 0 (blue or red)
  • The T3 moving average slope (ascending or descending = blue or red)
  • A GannHiLo signal (close is above the MA of Highs = blue, below the MA of Lows = red)

According to the original rules of the system, orders are triggered once all of the dots are from the same color, in two words, buy when all the dots are turned from red to blue and vice-versa. The complete system could have more rules, but I’m not aware of them.

The TVI needs Volumes to be calculated correctly (will not work on instruments that your broker don’t deal Volumes).

The indicator was converted from MT4 by a request in the spanish forum: Genesis-Matrix.Convertir de MQ4 a PRT


Share this

Risk disclosure:

No information on this site is investment advice or a solicitation to buy or sell any financial instrument. Past performance is not indicative of future results. Trading may expose you to risk of loss greater than your deposits and is only suitable for experienced investors who have sufficient financial means to bear such risk.

ProRealTime ITF files and other attachments : How to import ITF files into ProRealTime platform?

PRC is also on YouTube, subscribe to our channel for exclusive content and tutorials

  1. Juanjo • 09/10/2018 #

    Buenos Días,

    habia leido que la estrategia funcionaba bien para periodos inferiores a 1 horas. En periodo superiores que tal se comportaría?…..serviria para acciones?
    Gracias

    • Nicolas • 09/10/2018 #

      Creo que el indicador sigue siendo válido para cualquier período de tiempo o instrumento. Las condiciones son bastante simples y se basan en indicadores simples, por lo que deben ser consistentes para cualquier instrumento.

  2. Fr7 • 09/10/2018 #

    El sistema de trading “Genesis Matrix Trading“, se usa en gráficos de 5 Minutos. 
    Reglas de entrada a Mercado

    * El indicador “Genesis Matrix Trading” debe tener los 4 cuadrados del mismo color al cierre de la vela actual
    * Los inidicadores “Stochasticos” tanto el stochastico de 5minutos  y  el stochastico de 15minutos deben venir del área de 20 – 80 
    * El indicador Heiken hashi debe cerrar la actual vela por encima o por debajo de la media amarilla 5

    Sobre Stop Loss y Take Profit buscaremos áreas de S/R, el sistema nos proporciona un indicador que nos marca las zonas importantes, podemos establecer en esos puntos nuestro TP.

  3. Juanjo • 09/10/2018 #

    Gracias por la aclaracion

  4. fxforex93 • 09/10/2018 #

    Hello @Nicolas, I have a problem with this indicator. you can check the difference between MT4 and Prorealtime. For me the top bar as already red. ANd you can see small other difference . thank you .

  5. fxforex93 • 09/10/2018 #

    the link of this picture : https://www.cjoint.com/c/HJBmfRi5bGL

    • Nicolas • 09/10/2018 #

      ok, but 1. you are comparing different data (same broker or not?), same timezone? same custom trading hours?
      2. with IG, there are no Volumes for forex pairs.
      3. is it the same version of the dashboard that I have coded?

  6. fxforex93 • 09/10/2018 #

    Bonjour Nicolas. je vais vous parler en français. j’ai un simple abonnement prorealtime (je ne suis pas chez IG). je n’ai pas pris l’option volume. c’est peu etre pour cela que la barre du haut est toujours rouge. après je conçois qu’il y ai une petite différence. certains petits carrées ne sont pas les mêmes. Vous pensez que cette barre rouge que ne deviens jamais bleu viens de ce problème. j’ai simplement télécharger votre indicateur en haut de cette page. y a t’il un autre indicateur qui pourrai remplacer cela. merci

    • Nicolas • 09/10/2018 #

      Si il n’y a pas de volumes, le TVI ne pourra pas se calculer, donc oui le “problème” vient bien de cela.

  7. eckaw • 09/10/2018 #

    Hi Nicolas, I’m using this indicator when there is confluence over 3 different timeframes (5min, 15min, 1h) together with ADX to confirm the strength of the trend – entering positions in dips / pull-backs. Would it be possible to code a screener that looks for the colour of the 4 boxes of the genesis matrix indicator to match (all blue or all red) and ADX is over 20/25?

    • Nicolas • 09/10/2018 #

      Yes it is indeed possible. Create a topic in the screener forum and explain what you need and with screenshots if possible.

  8. KyleReed • 09/10/2018 #

    i’ve been using this for a few days now and it’s really helped me a lot in timing the execution and closing of trades. is it easily possible to add measurable output that can be used for example in a screener , because when trying it just says “no useable output” – just a row number and 0/1 signal?

avatar
Register or

Likes

avatar avatar avatar avatar avatar avatar avatar avatar avatar avatar avatar avatar avatar avatar avatar avatar

+15 more likes

Related users ' posts
Iván
2 months ago
Iván I personally like it in daily timeframe
oliTR Many thanks Ivan, I copy/paste your code to try it but could only get a constant stable unif...
Iván Hi, I've copied the code above and it works... what asset are you trying? $indices array ...
Ciccarelli Franco Sembra molto interessante e volevo dei chiarimenti se possibile :Le righe commentate vanno l...
KumoNoJuzza Thank you @philippe59139 !! We finally have the VAL / VAH to play with. Could you attach th...
Matriciel Very nice job ! Is it possible to do the opposite because what interests me is to have the ...
YvesRobert Hi Matriciel, how can we do this, because stochastic is limited between 0 and 100 but price ...
Traderfox06 Dear zeiiermantrading, I really like your approach combining adaptive averages with MACD in...
JS
9 months ago
luxrun
9 months ago
Nicolas Il doit y avoir impérativement plus d'unités affichées que le paramètre "BarsLimit". Ceci ét...
steffen_burat Hello Nicolas, I have a cumulative histogram update problem, the indicator often updates ...
taklause Hello Nicolas, if I try to use your indicator in a trading system, the error on prc pops up ...
Rafa Hi Nicolas! I can´t install this indicator. it installs in a separate window not as an av...
Nicolas Add it on the price, see how: https://www.prorealcode.com/blog/video-tutorials/how-to-add-an...
Frankyslo1 No consigo instalarlo en el precio en PRL-version 10
Khaled As this section of the forum is in English, I'll reply in English. I'm using PRT v11, so I d...
sal157011 Don't understand where it says: "Volume Pressure Histogram: Columns plotted in positive are ...
Khaled Not sure to understand the question. However, the columns (Histogram) represent the variable...
Alai-n Cela fonctionne très bien !!! Super Merci
andreabarbuscia Ciao Nicolas, molto bello questo indicatore, l'ho apprezzato molto. Lo sto testando insieme...
Alai-n Je poste ici un lien afin de mieux appréhender le CVD-Cumulative Volume Delta : https://www....
Nicolas
2 years ago
DELBERT Bonsoir , Nicolas , j'ai transféré votre indicateur sur ma PRT 10,3 et j'ai un méssage d'ére...
Nicolas Vous pouvez essayer en remplacant la ligne avec: vwapsd = sqrt(average[lengthz](square(clo...
DELBERT Bonsoir , merci Nicolas , a bientôt .
ChemaGeek Bonjour Nicolas, j'ai récemment découvert cet indicateur (Regularized Momentum 2017) et je l...
YvesRobert Bonjour, nouveau sur PRT (qq jours), j'essaie un peu de voir quel type d'indicateur me convi...
Ichimoku Reading I don't know in this case, I just downloaded it again and no problem for me. Try to downloa...
Ichimoku Reading What's the error that appears ?
Suzu Yuk Yes, it worked with 1Tick with 200 K . Thank you very much.
Daniele Maddaluno If you need to use it in PRT v11 take a look at this topic: https://www.prorealcode.com/top...
Monobrow Hi Daniele Thank you for the indicator, it looks very good. However, I have a problem so...
avatar
Anonymous Thanks very much for sharing, look forward to testing this idea out.
Barrabas15 Apparently, according to the attached data, there is an error in the indicator code. Attach...
Barrabas15 The files are at the end of the following link: https://www.prorealcode.com/topic/time-seg...
robertogozzi Thank you Barrabas15, the correct code is at https://www.prorealcode.com/topic/time-segmente...
Nicolas Merci d'ouvrir un sujet dans le forum des screeners en respectant les règles de publication ...
Pensera Bravo Nicolas ! Tu es en quelque sorte l’inventeur de Metascore…(oups je viens de lire jusqu...
Nicolas Dans un but d'investissement pure, et non spéculatif.
Nicolas esta possible
bolsatonimora2 Hola Nicolas, perdona la molestia, pero podrias codificar el screener para rupturas de sopor...
Nicolas Utilice los foros para solicitar una codificación personalizada.
GARNIEPI hello I am looking for an anchored vwap intraday, indicator which allows you to visualize th...
withoutwings To be able to flexibly wrap around the full 24h (i.e. past midnight), or to use just a singl...

Top