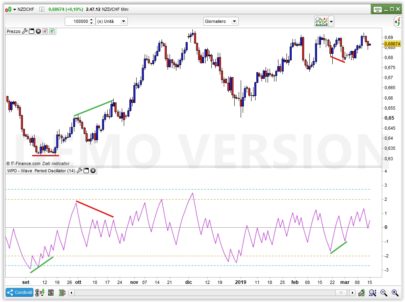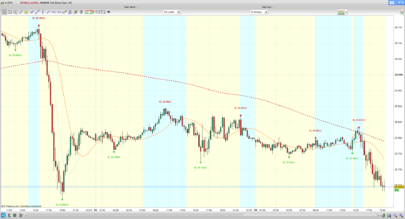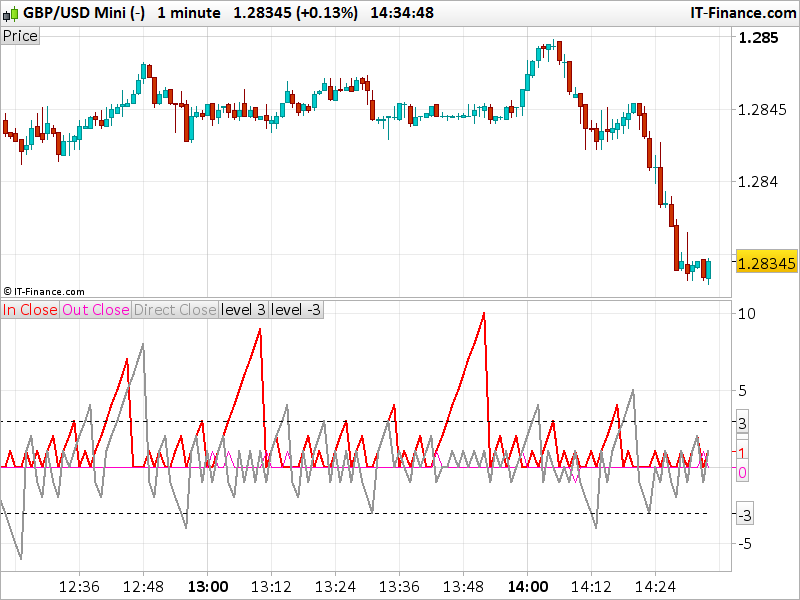
The Close Series indicator is used in combination with other indicators and gives exit points on short-term trend trading.
- Internal closing (red line) indicates closing which is located within the range of the previous bar. The series of such closings speak of “creeping” or horizontal movement. The longer the series, the more likely for a breakthrough, respectively, define the point (points) of entry using the other instruments.
- External/net closing (purple line) is a closing located above high and below low of the previous bar. Usually the series of the external closings include 3-5 bars and speak of either flat will run, or the price reverse.
- Single direction closing (grey line) is a current bar which closes in the same direction as the previous bar. The appearances of such series speaks that short-term trend is terminated.
- Each line’s value is the number of bars in the corresponding series.
Recommendations:
- It is recommended to use on older timeframes in combination with the other indicators.
- When a series of 3-4 external closings appears, close or at least defend the position.
- When a series of 4 or more closings appears, close or defend the deal.
- It is important: series of external and single directed bars are not the signals of reverse, but they testify of a current short-term trend termination.
Description from the author Serhii Ivanenko and translated from Russian.
Converted from MT5 code by a request on the french forum.
|
1 2 3 4 5 6 7 8 9 10 11 12 13 14 15 16 17 18 19 20 21 22 23 24 25 26 27 28 29 30 31 32 33 34 35 36 37 38 39 40 41 42 43 44 45 46 47 48 49 |
//PRC_Close Series | indicator //29.05.2017 //Nicolas @ www.prorealcode.com //Sharing ProRealTime knowledge //translated from MT5 code if ( close[0] <= high[1] and close[0] >= low[1] ) then if ( InCloseBuffer[1] > 0 ) then InCloseBuffer = InCloseBuffer[1] + 1 else InCloseBuffer = 1 endif else InCloseBuffer = 0 endif if ( open[0] > high[1] ) then if ( OutCloseBuffer[1] > 0 ) then OutCloseBuffer = OutCloseBuffer[1] + 1 else OutCloseBuffer = 1 endif elsif (open[0] < low[1] ) then if ( OutCloseBuffer[1] < 0 ) then OutCloseBuffer = OutCloseBuffer[1] - 1 else OutCloseBuffer = -1 endif else OutCloseBuffer = 0 endif //--- if ( close[0] > open[0] ) then if ( DirectCloseBuffer[1] > 0 ) then DirectCloseBuffer = DirectCloseBuffer[1] + 1 else DirectCloseBuffer = 1 endif elsif ( close[0] < open[0] ) then if ( DirectCloseBuffer[1] < 0 ) then DirectCloseBuffer = DirectCloseBuffer[1] - 1 else DirectCloseBuffer = -1 endif else DirectCloseBuffer = 0 endif RETURN InCloseBuffer coloured(255,0,0) style(line,2) as "In Close", OutCloseBuffer coloured(255,0,200) as "Out Close", DirectCloseBuffer coloured(150,150,150) style(line,2) as "Direct Close", 3 style(dottedline) as "level 3", -3 style(dottedline) as "level -3" |
Share this
No information on this site is investment advice or a solicitation to buy or sell any financial instrument. Past performance is not indicative of future results. Trading may expose you to risk of loss greater than your deposits and is only suitable for experienced investors who have sufficient financial means to bear such risk.
ProRealTime ITF files and other attachments :
Find other exclusive trading pro-tools on ![]()
PRC is also on YouTube, subscribe to our channel for exclusive content and tutorials