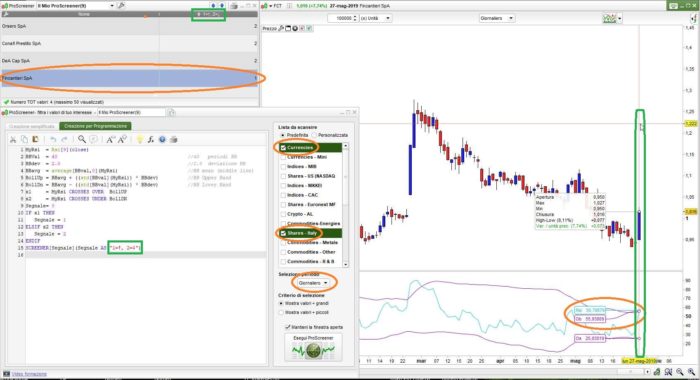
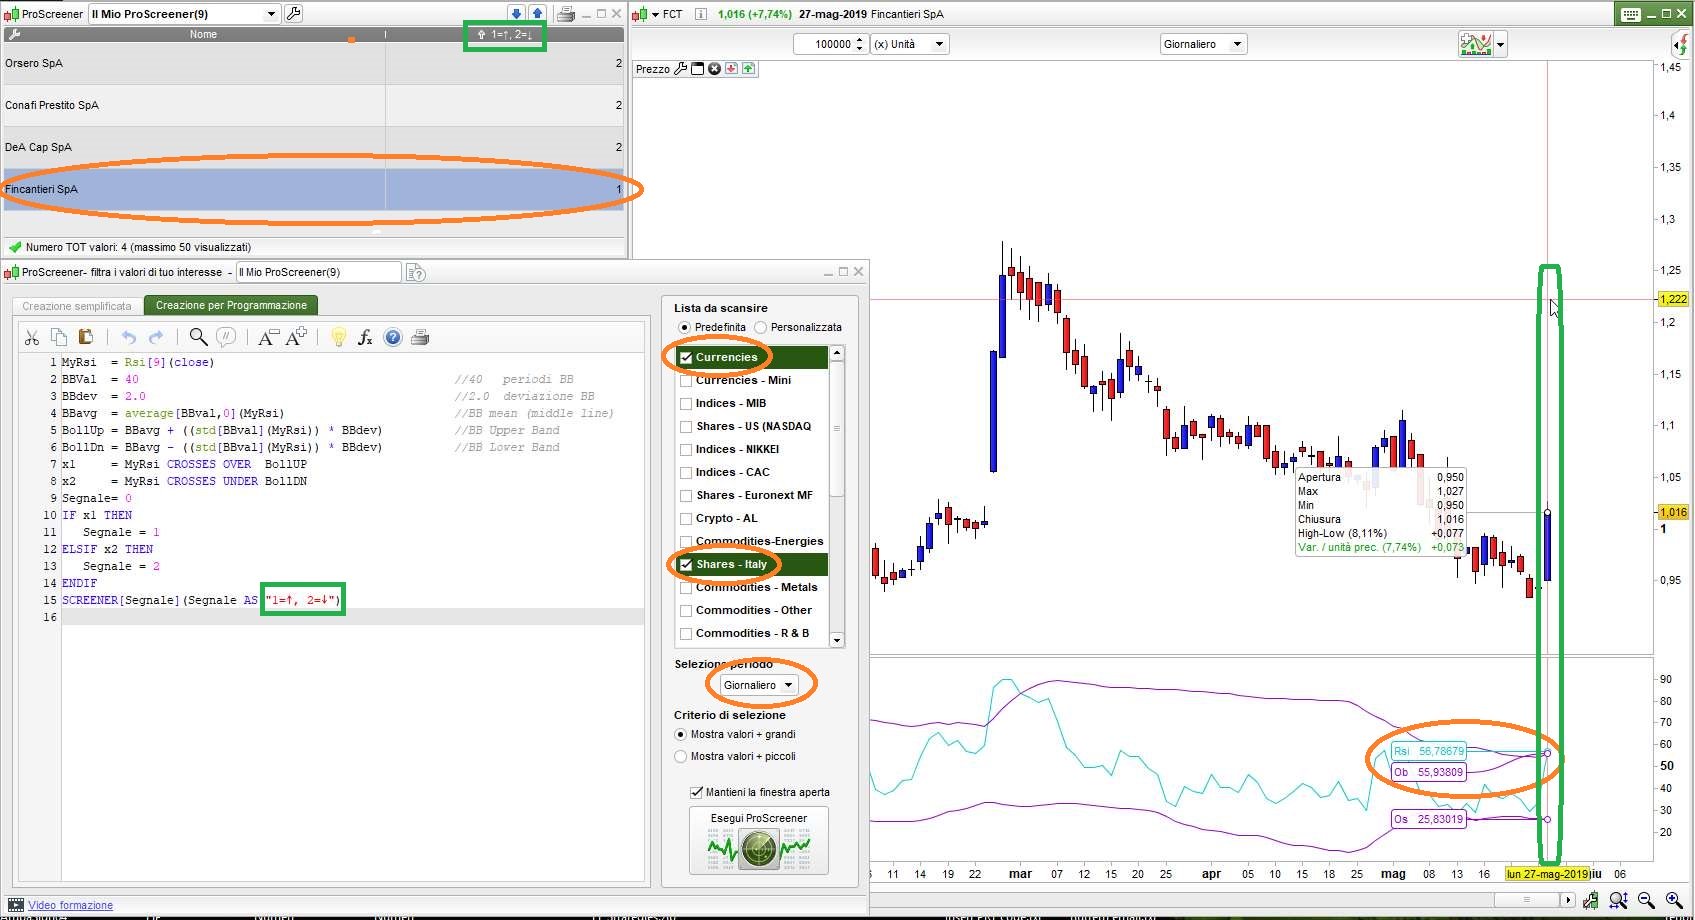
Following a request on the italian forum (https://www.prorealcode.com/topic/rsi-normalizzato-con-bb/), I made this screener to apply the Bollinger Bands to RSI, so that they act a OverBought/OverSold tresholds.
|
1 2 3 4 5 6 7 8 9 10 11 12 13 14 15 |
MyRsi = Rsi[9](close) //9 Rsi periods BBVal = 40 //40 BB periods BBdev = 2.0 //2.0 BB deviation BBavg = average[BBval,1](MyRsi) //BB mean (EMA middle line) BollUp = BBavg + ((std[BBval](MyRsi)) * BBdev) //BB Upper Band BollDn = BBavg - ((std[BBval](MyRsi)) * BBdev) //BB Lower Band x1 = MyRsi CROSSES OVER BollUP x2 = MyRsi CROSSES UNDER BollDN Signal= 0 IF x1 THEN Signal = 1 ELSIF x2 THEN Signal = 2 ENDIF SCREENER[Signal](Signal AS "1=↑, 2=↓") |
Share this
No information on this site is investment advice or a solicitation to buy or sell any financial instrument. Past performance is not indicative of future results. Trading may expose you to risk of loss greater than your deposits and is only suitable for experienced investors who have sufficient financial means to bear such risk.
ProRealTime ITF files and other attachments :
Find other exclusive trading pro-tools on ![]()
PRC is also on YouTube, subscribe to our channel for exclusive content and tutorials


Sube como trazar lineas de tendencias a tantas barras
interesting indicator !! Thanks for sharing!!!
Thank you 🙂