







Momentum Pinball
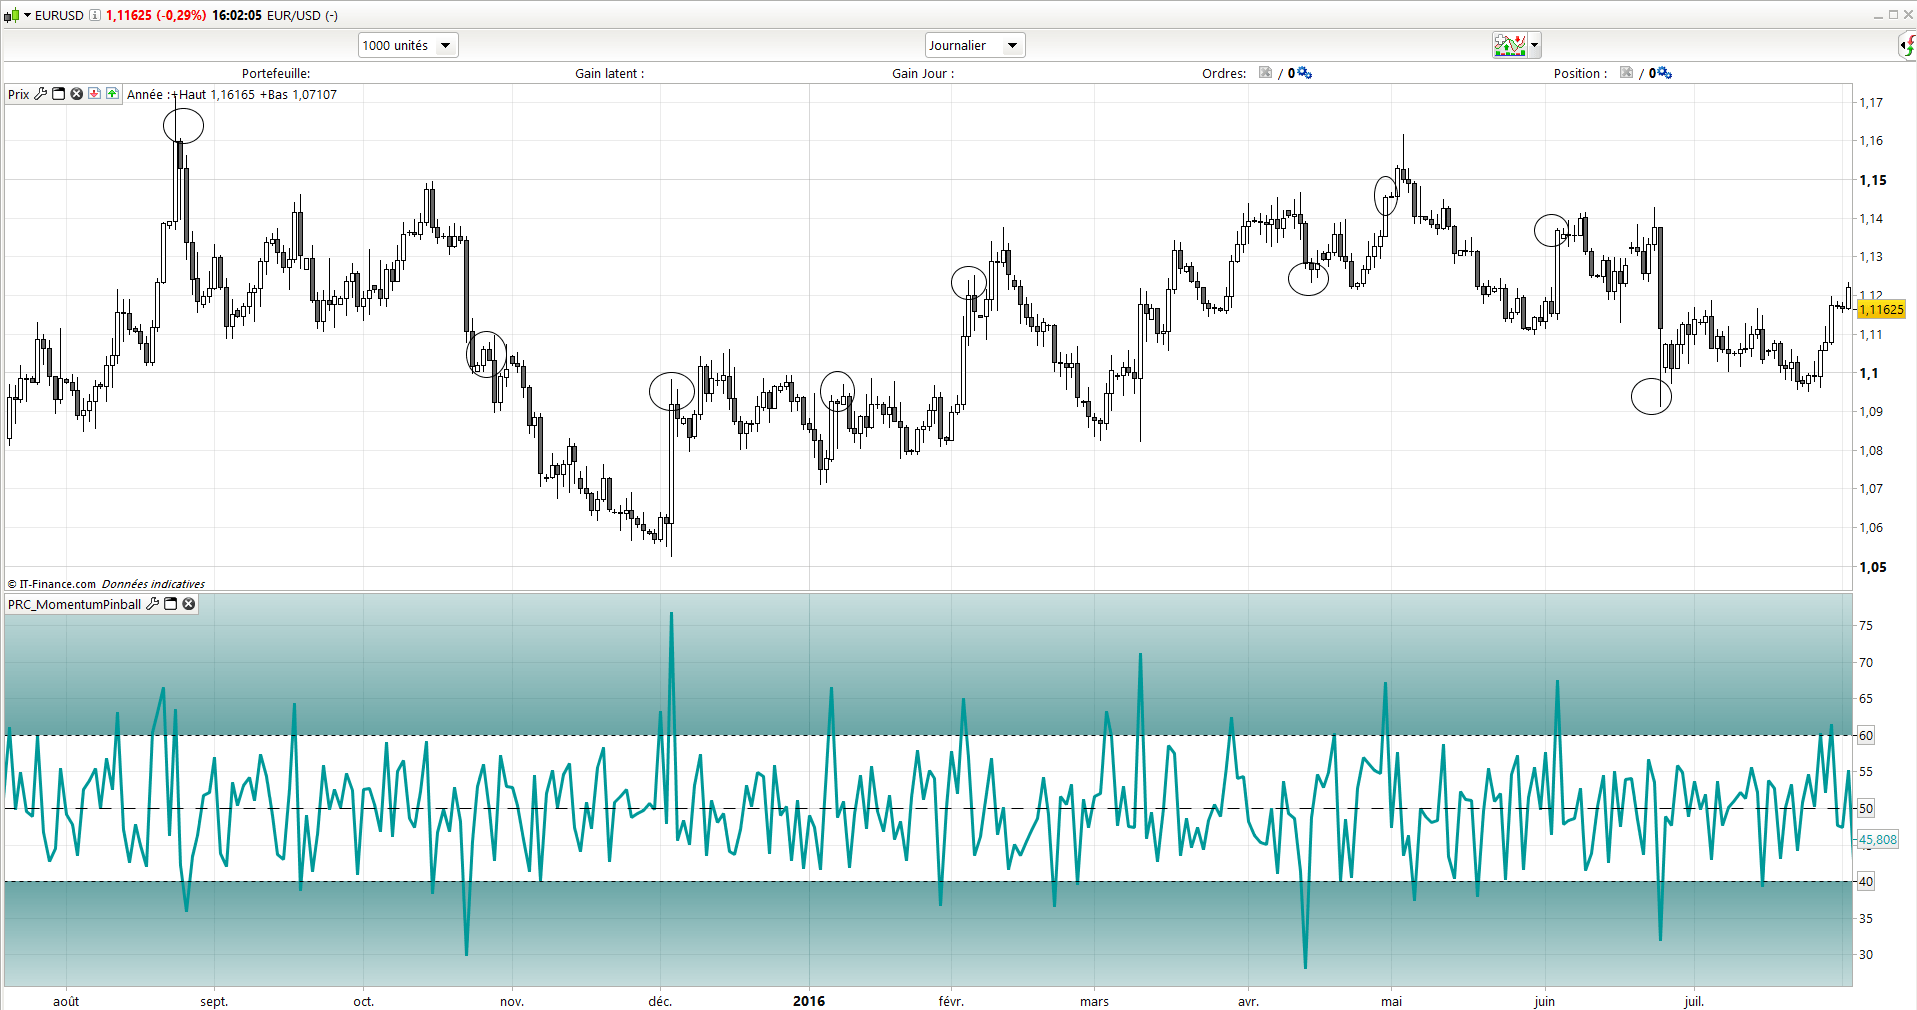
Based on a classical RSI formula, this indicator use the intraday price changed difference from the previous day, instead of the close.
It results a fast and accurate view of price acceleration (great momentum) of the current daily candlestick compared to analysed periods (14 periods in the code example).
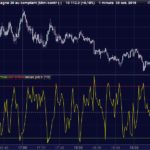
I marked examples of how to interpret the indicator on the above screenshot. When the oscillator value exceed the 60 level area, it should warn you of a large bullish pressure, and a bearish one when its below the 40 level.
//PRC_MomentumPinball
//02.09.2016
//Nicolas @ www.prorealcode.com
//Sharing ProRealTime knowledge

periods = 14

diff = Dclose(0)-Dclose(1)

if diff-diff[1]>=0 then
 u = diff-diff[1]
 d = 0
else
 u = 0
 d = diff[1]-diff
endif

mp = 100-(100/(1+(exponentialaverage[periods](u)/exponentialaverage[periods](d))))

RETURN mp as "Momentum Pinball", 60 as "60 level", 50 as "50 level", 40 as "40 level"
Comments
You must be logged in to post a comment.


Hi Nicolas, thanks a loto for sharing your knowliedge, Wasn't the original momentum pinball with ROC rather than exponential average? Best regards

Agree; thanks.
Hi Nicolas; what is Dclose?
ok, clear; I understand that Dclose(0) is not constant during the current day and is equal to the close of the last intraday bar, while Dclose(1) is obviously constant during the current day. Correct.
Is there some reason for this choice instead of using a more "normal" sliding close? I think there is.

Buonasera sig. Nicolas......sarebbe possibile far in modo che quando l'indicatore raggiunga livelli si 40 oppure di 60 vengano indicati mediante simboli ( o frecce) direttamente sul grafico dei prezzi? Grazie.