

Bollinger bands candlesticks colors
August 27, 2016, 1:07 PM
Indicators
2 Comments
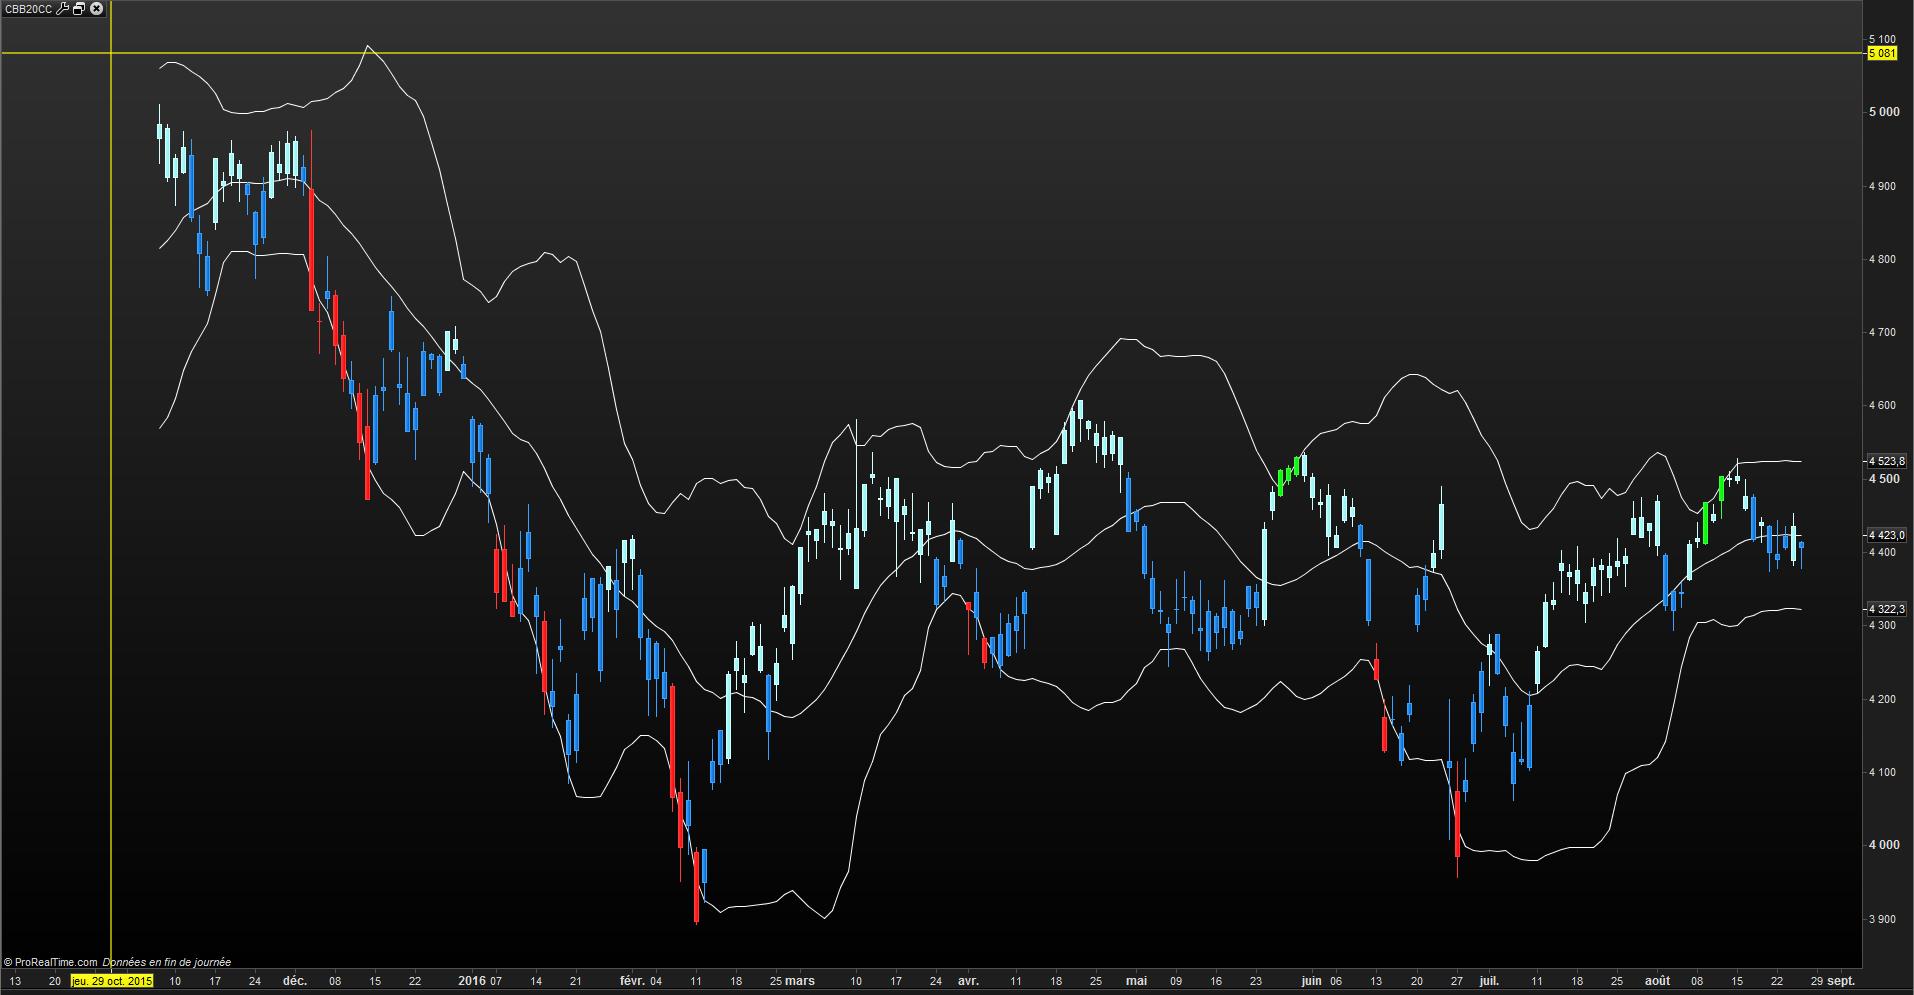
![]() Voici un indicateur basé sur les bandes de Bollinger, les bougies changent de couleurs selon leur “close”
Voici un indicateur basé sur les bandes de Bollinger, les bougies changent de couleurs selon leur “close”
au dessus de la bande haute = vert
entre le milieu et le haut = bleu ciel
sous la bande basse = rouge
entre le milieu et la bande basse = bleu
Vous pouvez adapter le système à vos bandes préférées
bons trades.
![]() Here is an indicator based on Bollinger Bands, candles change color according to their “close”
Here is an indicator based on Bollinger Bands, candles change color according to their “close”
High above the band = green
between the middle and up = light blue
under lowest band = red
between the middle and the lowest band = blue
You can adapt the system to your prefered bands
good trades.
// CLOSE BB20 COLOR CHANGE CBB20CC
med = Average[20](close)
dst = STD[20](close)
bes = med + (2 * dst)
bei = med - (2 * dst)
////////////////////////////////
If close > bes then
 DRAWCANDLE(open,high,low,close) COLOURED(0,255,0) // vert
Endif

If close > med and close < bes then
 DRAWCANDLE(open,high,low,close) COLOURED(153,255,255) // bleu ciel
Endif

If close < bei then
 DRAWCANDLE(open,high,low,Close) COLOURED(255,0,0) // rouge
endif

If close < med and close > bei then
 DRAWCANDLE(open,high,low,Close) COLOURED(0,102,204) // bleu
endif

Return med as " med " , bes as " bes " , bei as " bei "
Download
Filename:
Bollinger-B-candlestick-colors.itf
Downloads:
212
Master
mal nommer les choses est ajouter à la misère du monde --- A. Camus
Author’s Profile
Loading...