

RMI Trend Sniper Indicator
RMI Trend Sniper: An Innovative Trading Indicator
The RMI Trend Sniper indicator is designed to identify market trends and trading signals with remarkable precision.
This tool combines the analysis of the Relative Strength Index (RSI) with the Money Flow Index (MFI) and a unique approach to range-weighted moving average to offer a comprehensive perspective on market dynamics.
Configuration and Indicator Parameters
The RMI Trend Sniper allows users to adjust various parameters according to their trading needs, including:
- RMI Length: Defines the calculation period for the RMI.
- Positive and Negative Momentum (Positive above / Negative below): Sets thresholds to determine the strength of bullish and bearish trends.
- Range MA Visualization (Show Range MA): Enables users to visualize the range-weighted moving average, along with color indications to quickly identify the current market trend.
How the Indicator Works
The RMI Trend Sniper is based on the modified RSI and MFI calculation logic to assess buying or selling pressure in the market.
Through a weighted average, the indicator adjusts sensitivity to price changes, providing more accurate signals.
The inclusion of an analysis based on the range of bars (Bar Range) allows for a detailed visual representation of price fluctuations, highlighting areas of potential trend reversal or continuation.
Interpretation of Signals
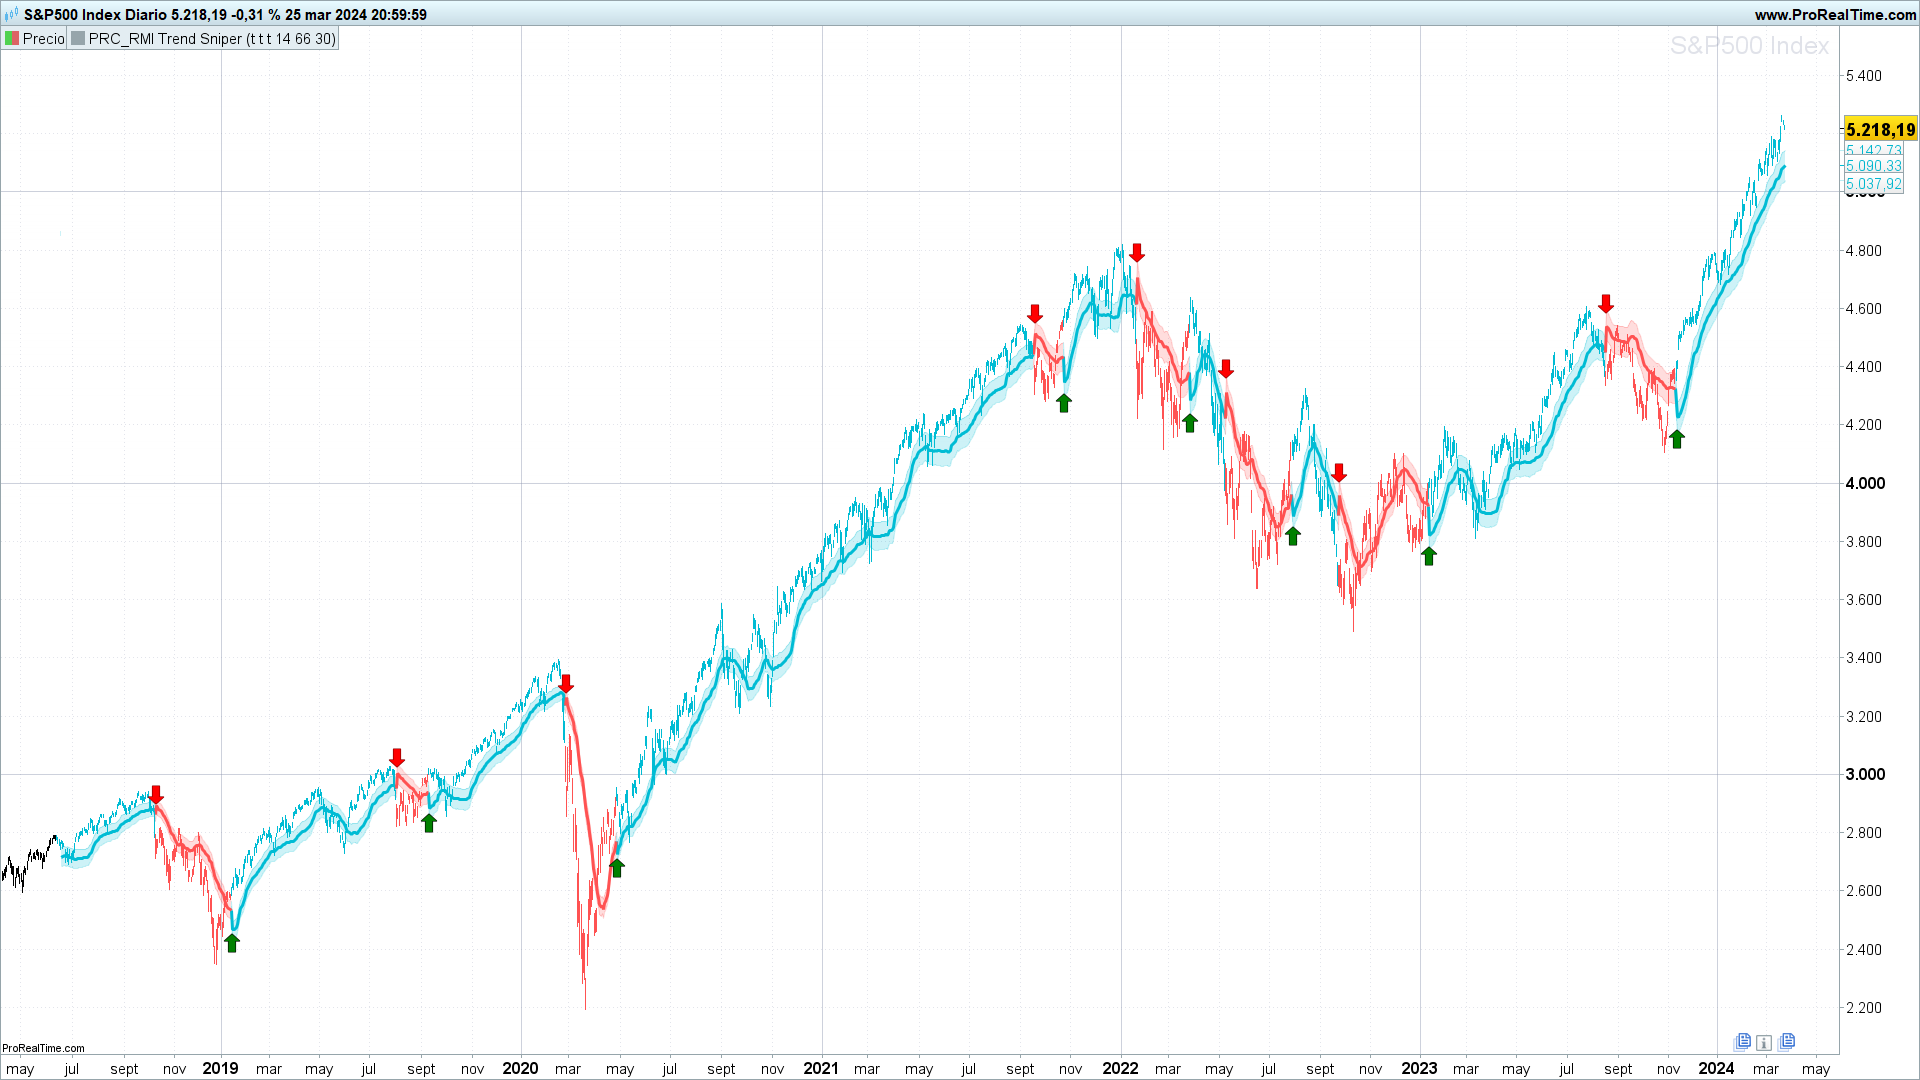
The signals generated by the RMI Trend Sniper are displayed on the chart as changes in the color of the bars and moving averages, along with labels marking the suggested entry points:
- Bullish Trend: Indicated by shades of blue and the appearance of green labels, suggesting an opportune moment to consider long positions.
- Bearish Trend: Signaled by shades of red and red labels, indicating potential opportunities to enter short positions.
Trading Strategies and Applications
The RMI Trend Sniper is suitable for a wide range of trading strategies, from scalping to swing trading, thanks to its ability to adapt to different time frames and markets. Traders can use this indicator to:
- Identify entry and exit points based on the strength and direction of the trend.
- Complement other technical analysis tools to confirm trading signals.
- Implement risk management strategies by identifying changes in market trend.
ProRealtime Code
//PRC_RMI Trend Sniper
//version = 0
//26.03.24
//Iván González @ www.prorealcode.com
//Sharing ProRealTime knowledge
//-----Inputs----------------------------------------------//
Length=14//RMI Length
pmom=66//Positive above
nmom=30//Negative below
filleshow=1//Show Range MA
colorbar=1//Color candles
drawsignals=1//Show arrows
//-----RSI and MFI calculation-----------------------------//
alpha = 1/length
//-----Up
src1 = max(close-close[1],0)
if barindex = length then
up = average[length](src1)
else
up = alpha*src1 + (1-alpha)*up[1]
endif
//-----Down
src2 = - min(close-close[1],0)
if barindex = length then
down = average[length](src2)
else
down = alpha*src2 + (1-alpha)*down[1]
endif
//-----Rsi
if down = 0 then
myrsi = 100
elsif up = 0 then
myrsi = 0
else
myrsi = 100 - (100/(1+up/down))
endif
//-----MFI
mfi = MoneyFlowIndex[length]
//-----RsiMfi
rsimfi = (myrsi+mfi)/2
//----------------------------------------------------------//
//-----Long Short Conditions--------------------------------//
ema = average[5,1](close)

bpmom = rsimfi[1]<pmom and rsimfi>pmom and rsimfi>nmom and (ema-ema[1])>0
bnmom = rsimfi<nmom and (ema-ema[1])<0

if bpmom then
positive = 1
negative = 0
elsif bnmom then
positive = 0
negative = 1
endif
//----------------------------------------------------------//
//------Calculate RWMA--------------------------------------//
band = min(averagetruerange[30]*0.3,close*(0.3/100))[20]/2*8
barRange = high-low

weight = BarRange/summation[20](BarRange)
sum = summation[20](close*weight)
tw = summation[20](weight)
rwma = sum/tw

if positive then
rwma = rwma-band
r=0
g=188
b=212
elsif negative then
rwma = rwma+band
r=255
g=82
b=82
else
rwma = undefined
endif
//------------------------------------------------------------//
//-----Calculate MA bands-------------------------------------//
if filleshow then
mitop = rwma+band
mibot = rwma-band
colorbetween(mitop,rwma,r,g,b,50)
colorbetween(mibot,rwma,r,g,b,50)
else
mitop = rwma
mibot = rwma
endif
//-----------------------------------------------------------//
//-----Draw signals------------------------------------------//
if drawsignals then
if negative and not negative[1] then
drawarrowdown(barindex,mitop+(band/2))coloured("red")
elsif positive and not positive[1] then
drawarrowup(barindex,mibot-(band/2))coloured("green")
endif
endif
//-----------------------------------------------------------//
//-----Color Candles-----------------------------------------//
if colorbar then
drawcandle(open,high,low,close)coloured(r,g,b)
endif
//-----------------------------------------------------------//
return rwma as "Rwma"coloured(r,g,b)style(line,3), mitop as "Max"coloured(r,g,b,70)style(line,1),mibot as "Min" coloured(r,g,b,70)style(line,1)
