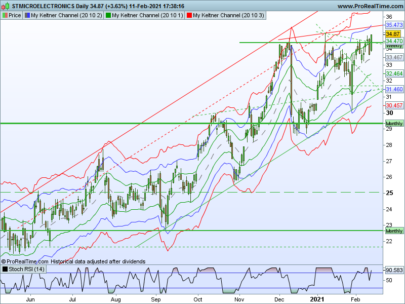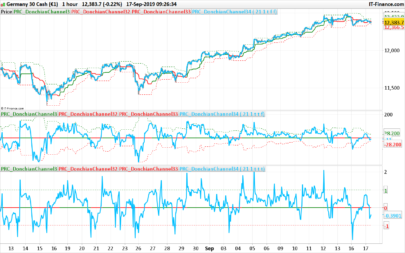
The StopLoss indicator uses the Keltner band in several values, 50-100-150-200.
The code will calculate the average of the upper bands, then the average of the lower bands.
We then obtain an average Keltner band between these four values, which helps to smooth the band and avoid abrupt changes.
The upper band will be subtracted from the lower band, the result will then be the standard deviation of the court over an average period of time.
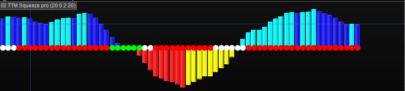
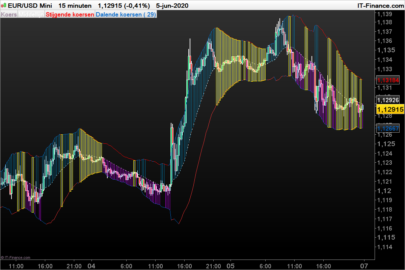
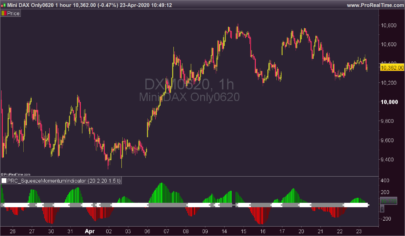
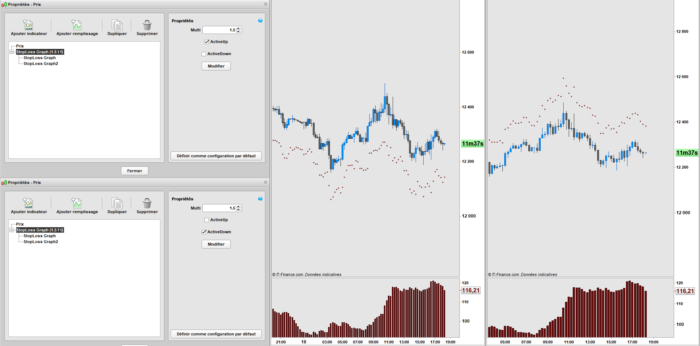
The indicator gives you the result in the form of a histogram.
You can use the external variable to get a higher or lower result at your convenience.
The goal is to transmit the volatility with regularity and without excess.
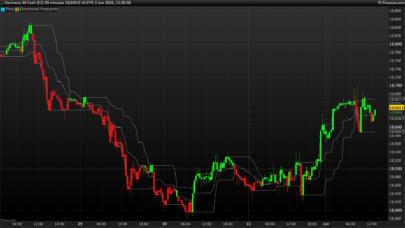
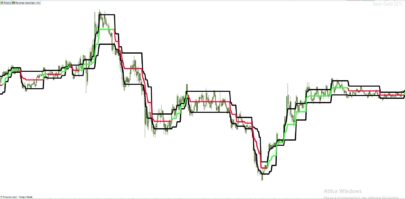
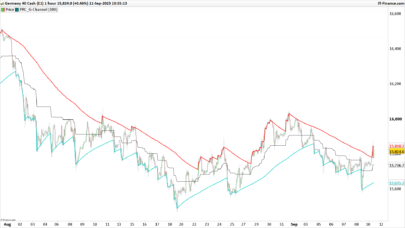
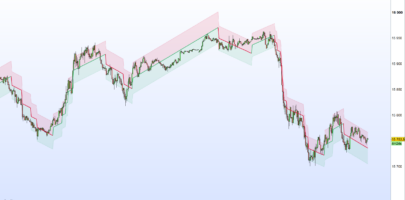
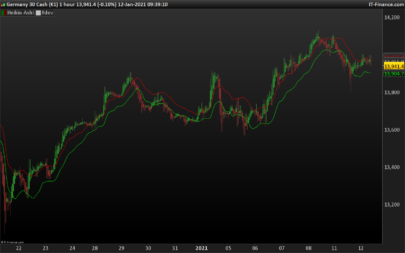
You also have a dotted graphical indicator, which shows you the calculated distance to the StopLoss.
On this graphical indicator, you can activate or deactivate the points if you don’t need to see them.
Sincerely yours,
|
1 2 3 4 5 6 7 8 9 10 11 12 13 14 15 16 17 18 19 20 |
//Keltner Band MA1 = Average[50,0](TypicalPrice) Up1 = MA1 + (Multi*Average[50,1](Range)) Down1 = MA1 - (Multi*Average[50,1](Range)) MA2 = Average[100,0](TypicalPrice) Up2 = MA2 + (Multi*Average[100,1](Range)) Down2 = MA2 - (Multi*Average[100,1](Range)) MA3 = Average[150,0](TypicalPrice) Up3 = MA3 + (Multi*Average[150,1](Range)) Down3 = MA3 - (Multi*Average[150,1](Range)) MA4 = Average[200,0](TypicalPrice) Up4 = MA4 + (Multi*Average[200,1](Range)) Down4 = MA4 - (Multi*Average[200,1](Range)) Up = (Up1+Up2+Up3+Up4)/4 Down = (Down1+Down2+Down3+Down4)/4 Value = (Up-Down) RETURN Value coloured(107,13,13,200) style (histogram) |
|
1 2 3 4 5 6 7 8 9 10 11 12 13 14 15 16 17 18 19 20 21 22 23 24 25 26 27 28 29 30 31 32 33 34 35 36 37 38 39 40 41 42 43 44 45 46 47 48 49 50 51 |
//Indicator Graph MA1 = Average[50,0](TypicalPrice) Up1 = MA1 + (Multi*Average[50,1](Range)) Down1 = MA1 - (Multi*Average[50,1](Range)) MA2 = Average[100,0](TypicalPrice) Up2 = MA2 + (Multi*Average[100,1](Range)) Down2 = MA2 - (Multi*Average[100,1](Range)) MA3 = Average[150,0](TypicalPrice) Up3 = MA3 + (Multi*Average[150,1](Range)) Down3 = MA3 - (Multi*Average[150,1](Range)) MA4 = Average[200,0](TypicalPrice) Up4 = MA4 + (Multi*Average[200,1](Range)) Down4 = MA4 - (Multi*Average[200,1](Range)) Up = (Up1+Up2+Up3+Up4)/4 Down = (Down1+Down2+Down3+Down4)/4 //Paramettre LimiteDown = low-(Up-Down) LimiteUP = high+(Up-Down) //UP if ActiveUp then Ra = 107 Ga = 13 Ba = 13 Ea = 200 else Ra = 0 Ga = 0 Ba = 0 Ea = 0 endif //Down if ActiveDown then Rb = 107 Gb = 13 Bb = 13 Eb = 200 else Rb = 0 Gb = 0 Bb = 0 Eb = 0 endif RETURN LimiteUP coloured(Ra,Ga,Ba,Ea) style(point,3) as "LimiteUP", LimiteDown coloured(Rb,Gb,Bb,Eb) style(point,3) as "LimiteDown" |
Share this
No information on this site is investment advice or a solicitation to buy or sell any financial instrument. Past performance is not indicative of future results. Trading may expose you to risk of loss greater than your deposits and is only suitable for experienced investors who have sufficient financial means to bear such risk.
ProRealTime ITF files and other attachments :
Find other exclusive trading pro-tools on ![]()
PRC is also on YouTube, subscribe to our channel for exclusive content and tutorials