




More from ProRealCode
ProRealCode - Trading & Coding with ProRealTime™
The ProRealTime™ community on the web! Officially sharing ProRealTime knowledge to Worldwide users since 2015!



Directional Frequency
June 3, 2024, 1:22 PM
Indicators
1 Comment
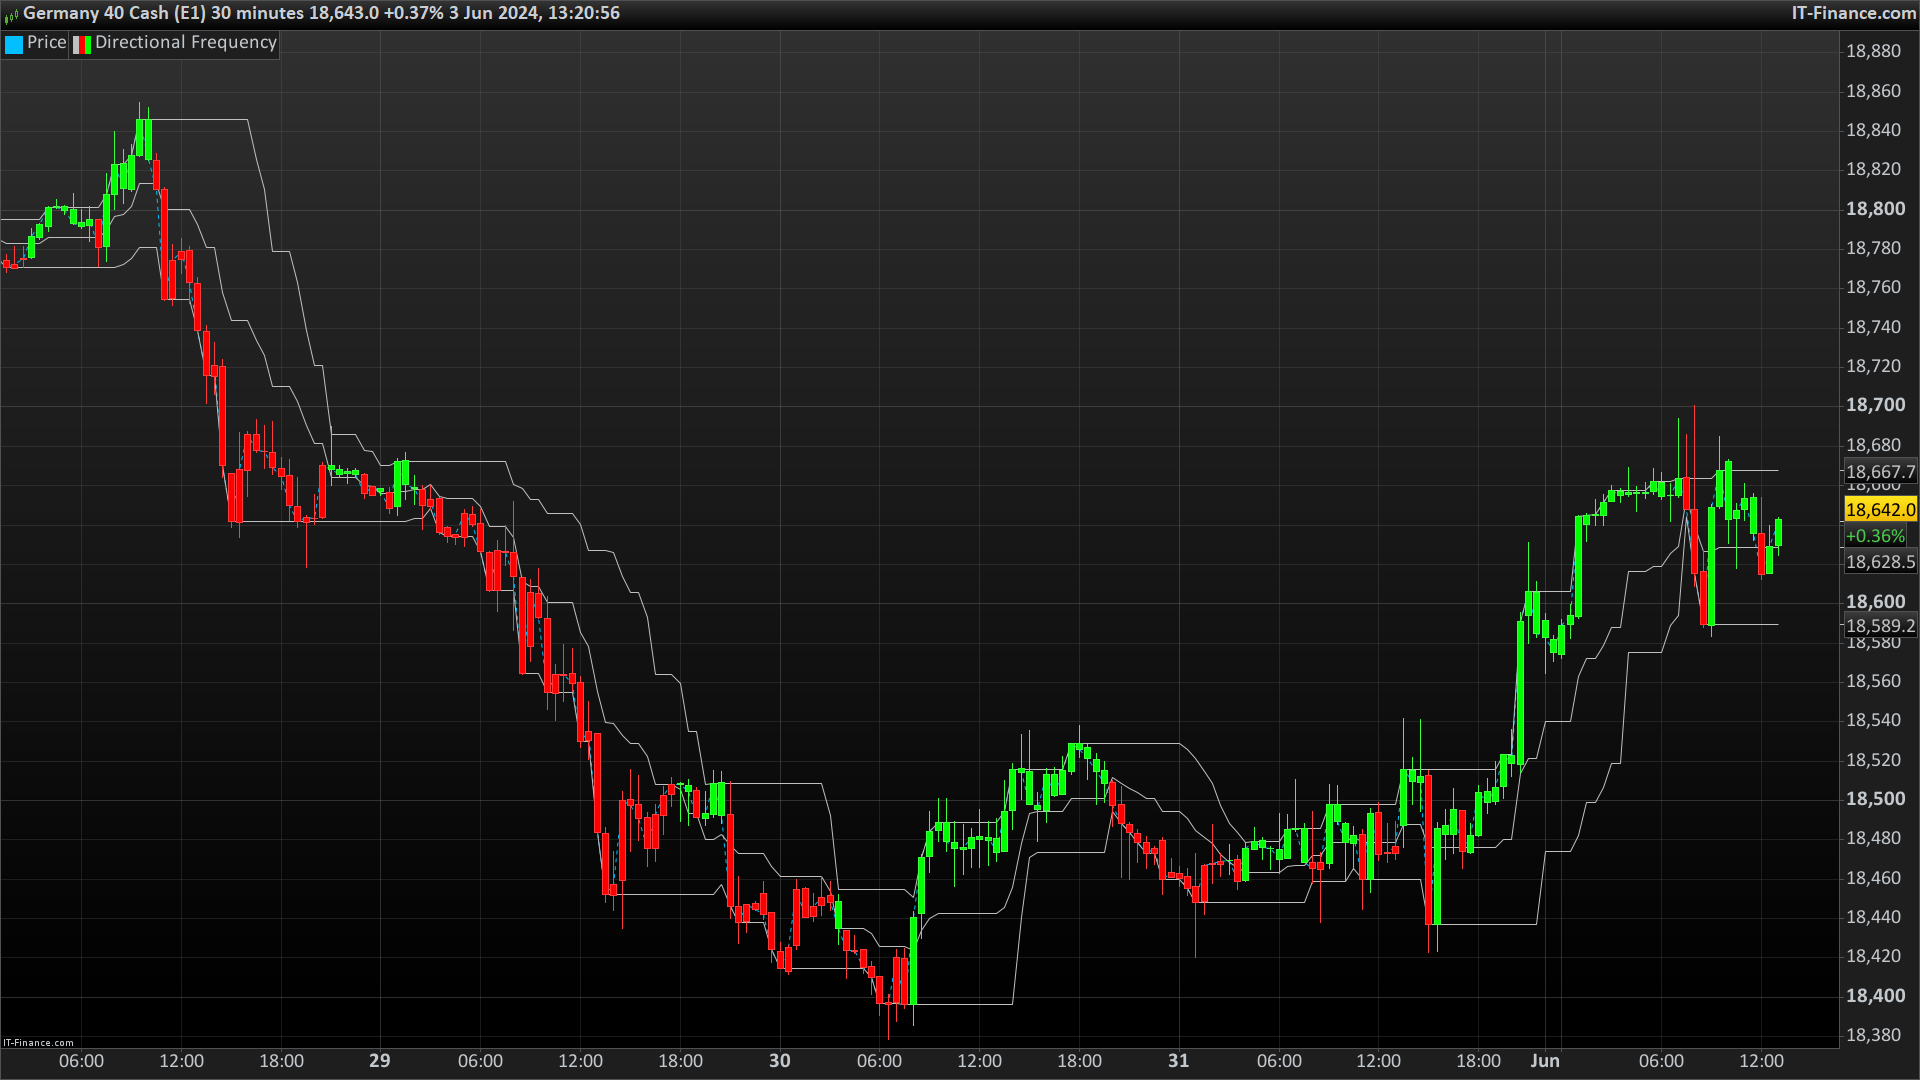
directional frequency is a very simple indicator, which visually shows when the price is in a bullish or bearish trend, comparing its position with the average of the close high and low calculated over the past period. It is possible to adjust the period parameter as desired to adapt it to your trading needs. In fact, it is set by default to 14, like the RSI, exclusively by convention.
Happy trading everyone!
period=14
///////highest close & lowest close calculation////////
hi=highest[period](close)
lo=lowest[period](close)
o=(hi+lo)/2
///////Signal///////
if close>o then
r=0
g=255
b=0
endif
if close<o then
r=255
g=0
b=0
endif
////print green and red candles if bullish or bearish///
DRAWCANDLE(open, high, low, close) coloured (r,g,b)

return hi as "hi", lo as "lo", o as "o"
Download
Filename:
Directional-Frequency.itf
Downloads:
140
Average
As an architect of digital worlds, my own description remains a mystery. Think of me as an undeclared variable, existing somewhere in the code.
Author’s Profile
Similar code
Trend Impulse FilterIndicators
Reversal signal ThreeLineBreakIndicators
Donchian bias determinatorIndicators
Reverse DonchianIndicators
Loading...
Bonjour, J'ai une question etes vous trader? Je m'explique , j'ai téléchargé tous les indicateurs proposés sur la bibliothèque depuis un certain temps et le votre est le seul qui apporte vraiment quelque chose, simple et efficace à l'inverse de tous les autres . C'était également vrai avec ceux de Nicolas. Je ne veux pas être méchant mais tout le reste n'est rien d'autre que de l'apparat qui ne sert a rien en trading journalier mis a part peut être le gaussian channel mais pas exploitable en l'état. cdlt