







RedOrBlue - RoB indic
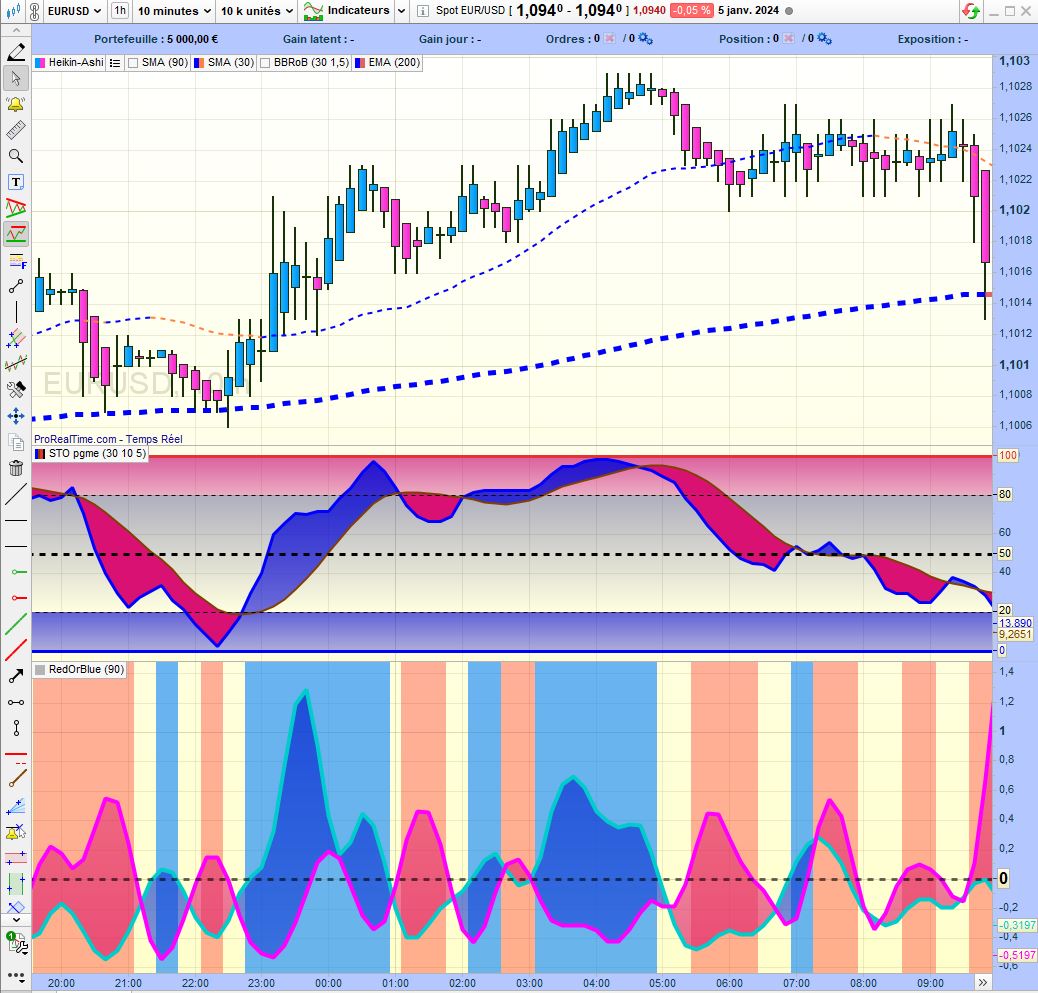
Understanding the RedOrBlue (RoB) Trading Indicator
Introduction:
The RedOrBlue (RoB) indicator is a revolutionary tool in financial trading, offering deep insights into market trends and potential reversals. This guide provides an in-depth look at how the RoB functions and its applications in trading.
Calculating the RoB:
At its core, the RoB indicator is calculated using differences between the opening and closing prices of stocks. This section details the specific mathematical formulae used to derive the RoB values, highlighting the importance of precise calculations for accurate market analysis.
Interpreting the RoB:
Understanding the RoB is crucial for making informed trading decisions. This part of the guide focuses on interpreting the various signals the RoB indicator provides, such as identifying bullish or bearish trends and predicting potential market reversals.
Applications in Trading:
The practical application of the RoB indicator is vast. Traders can use it to enhance their market analysis, complementing other tools and strategies. This section offers real-world examples of how the RoB can be integrated into daily trading activities.
Conclusion:
The RedOrBlue indicator is a valuable addition to any trader’s toolkit, providing a unique perspective on market dynamics. This guide aims to equip traders with the knowledge to effectively utilize the RoB in their trading strategies.
// Auteur : Gabriel GOUSSET
period = 14


diff = Close- Open
if diff >= 0 then
Bleu = diff
Rouge = 0
else
Bleu = 0
Rouge = -diff
endif

MoyBleu = Average[period](Bleu)
crBleu = (Bleu - MoyBleu)/STD[period](Bleu)

MoyRouge = Average[period](Rouge)
crRouge = (Rouge - MoyRouge)/STD[period](Rouge)

r=4
s=3
u=2

crB = Average[u](Average[s](Average[r](crBleu)))
crN = Average[u](Average[s](Average[r](crRouge)))

IF crB >= crN then // AND crB >= 0 THEN
backgroundcolor (0,127,255,150)
ENDIF

IF crN >= crB then // AND crN >= 0 THEN
backgroundcolor (255,0,0,80)
ENDIF

IF (crN < 0) and (crB < 0) then // AND crN >= 0 THEN
backgroundcolor (0,0,0,0)
ENDIF

horz = 0

return crB Coloured (0,204,203) as "Variation des Bleus" , crN Coloured (255,0,255) as "Variation des Rouges", horz Coloured (0,0,0,150) as "Ligne Zéro"
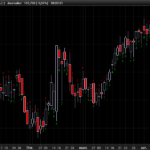
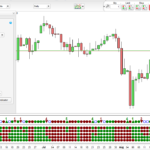
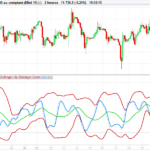

Merci Nicolas pour ces encouragements et merci aussi pour le commentaire en Anglais accompagnant mon schéma ci-dessus. RoB est un indicateur que j'aime utiliser car il réagit vite et très souvent avec justesse aux ralentissements et aux changements de direction. RoB peut aussi suggérer un marché atone si les deux traces sont en dessous de zéro et relativement parallèles à la ligne zéro sur plusieurs barres. Enfin, l'information fournie est relativement indépendante de la période retenue pour les calculs à condition, toutefois, de ne pas retenir une valeur trop faible pour cette période afin que le calcul des moyennes et écart-types glissants ne soient pas trop sensibles à quelques closes un peu erratiques. A chacun de retenir une valeur lui semblant convenable, pour ma part, je pense qu'une variation de la période sur l'intervalle [15 : 90] donne une information à peu près constante. Je travaille actuellement sur la présentation de deux autres indicateurs et je pense pouvoir publier l'un d'eux la semaine prochaine. Bien cordialement, Gabriel