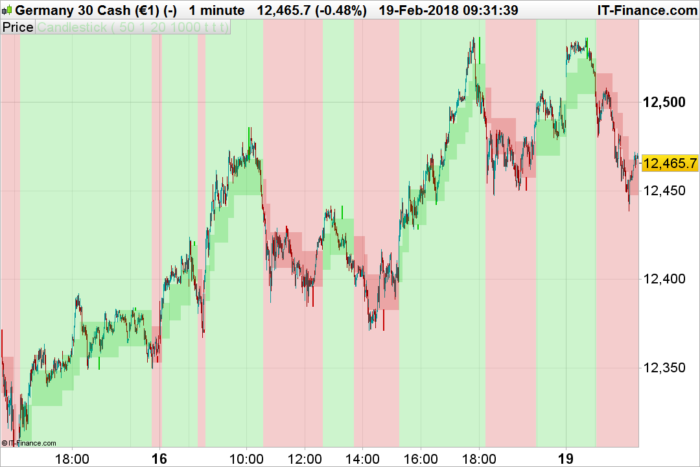
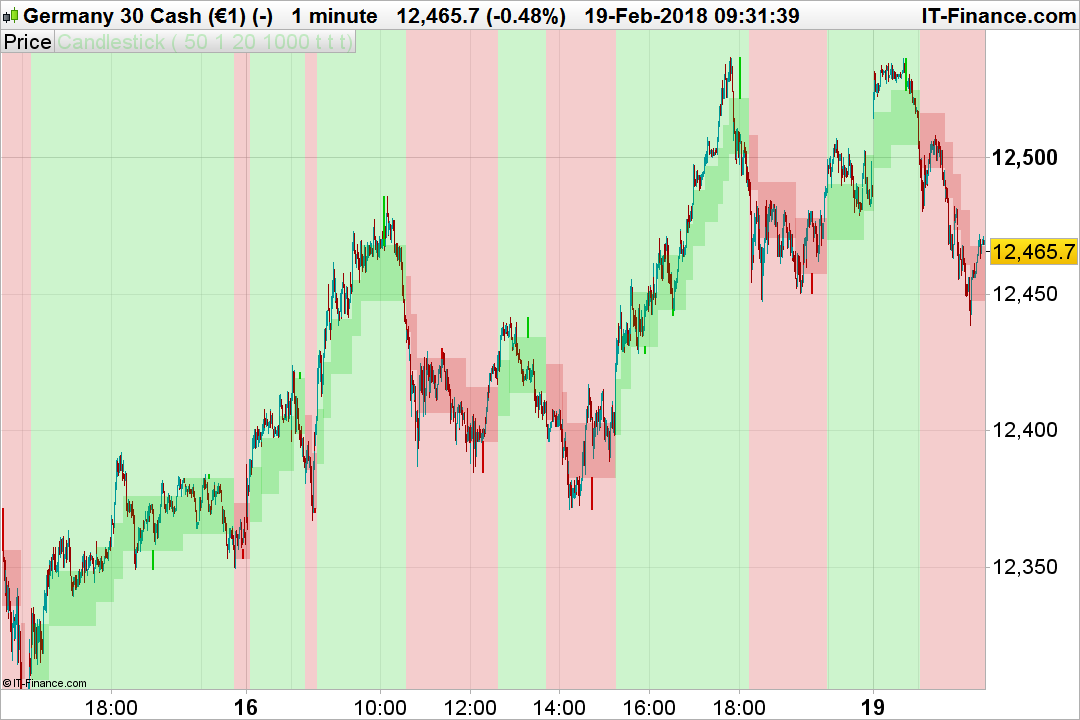
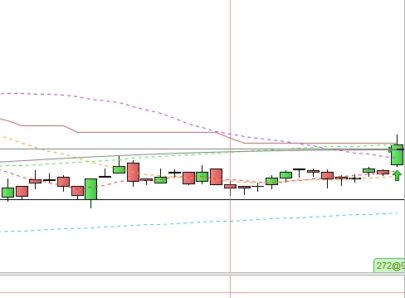
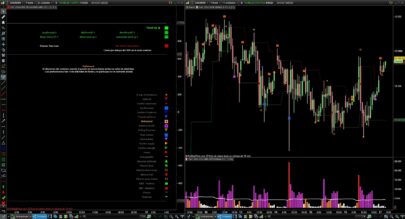
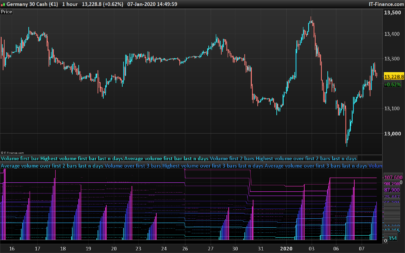
This version of the renko indicator for prorealtime, adds the Volume information to allow or not the construction of new brick.
I introduced several “experimental” parameters to adapt the indicator to the displayed instrument.
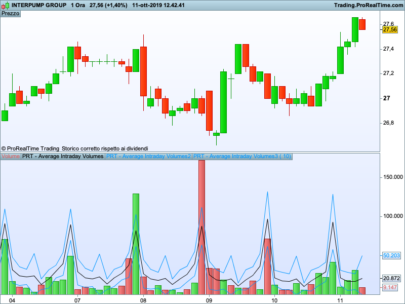
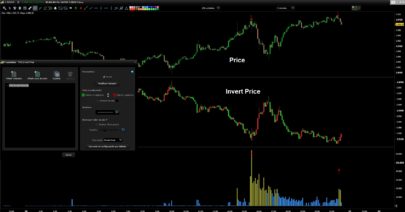
Renko bricks can be built using a fixed point size defined by the “boxsize” parameter, a new brick will be built only if the volume of exchanges has been at least greater than the “volumesize” parameter since the last brick .
These settings being very strict, I added an automatic feature for a more convenient adaptation to each instrument and timeframe. Thus, the parameters “autoRenko” and “autoVolume” allow a more ‘user friendly’ approach:
_ autoRenko means automatic renko brick size based on 2 time ATR periods.
_ autoVolume means automatic volume size to allow new brick or not (override the “volumesize” setting), based on average of Volumes.
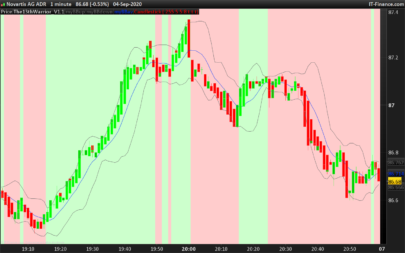
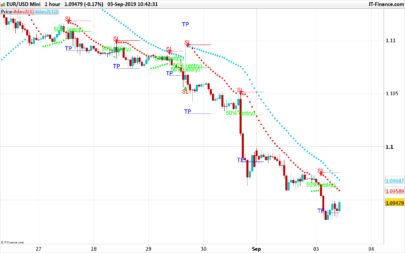
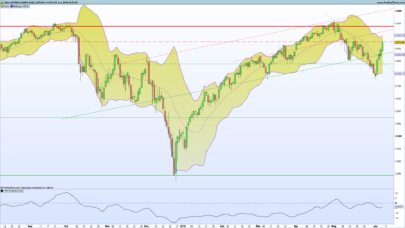
It is possible or not to “paint” the background of the graph according to the trend identified by the reversal of the bricks (parameter ‘showBG’).
This indicator is experimental and I invite you to discuss it in case you have ideas for improvement or concrete use in this topic of the forum: New Renko System
|
1 2 3 4 5 6 7 8 9 10 11 12 13 14 15 16 17 18 19 20 21 22 23 24 25 26 27 28 29 30 31 32 33 34 35 36 37 38 39 40 41 42 43 44 45 46 47 48 49 50 51 52 53 54 55 56 57 58 59 60 61 62 63 64 65 66 67 68 69 70 71 72 73 74 75 76 77 78 79 80 81 82 83 84 85 86 87 88 89 90 91 92 93 94 95 96 97 98 99 |
//PRC_Renko Bricks Volumes | indicator //19.02.2018 //Nicolas @ www.prorealcode.com //Sharing ProRealTime knowledge // https://www.prorealcode.com/topic/new-renko-system/ //---settings transparency=50 //brick colours alpha wicksize=1 //width of wicks boxsize=20 //renko bricks size in points/pips volumesize=1000 //volume size setting to allow new brick showBG=1 //background color (true/false) autoRenko=1 //automatic renko brick size based on 2 time ATR periods autoVolume=0 //automatic volume size to allow new brick or not (override the "volumesize" setting) based on average of volume instead of fixed value //---end of settings if autoRenko=1 then size=averagetruerange[14]*2 else once size=boxsize*pointsize endif if autoVolume then volumesize=average[1000](volume)*10 endif once upbox = close once downbox = close - (boxsize*pointsize) once lowwick = close*100 volumesum = volumesum+volume IF close > upbox + size and volumesum-lastvolume>=volumesize THEN lastvolume = volumesum upbox = upbox + size downbox = downbox + size r=0 g=200 begin=barindex highwick=close wickbar=barindex-round((barindex-begin[1])/2) ELSIF close < downbox - size and volumesum-lastvolume>=volumesize THEN lastvolume = volumesum upbox = upbox - size downbox = downbox - size r=200 g=0 begin=barindex wickbar=barindex-round((barindex-begin[1])/2) ENDIF //saving current high/low highwick=max(high,highwick) lowwick=min(low,lowwick) //compute wicks at each new contrarian brick if r>0 and r[1]=0 then //new red brick drawrectangle(wickbar,highwick,wickbar+wicksize,upbox[1]) coloured(r[1],g[1],0) lowwick=low*100 highwick=0 endif if r=0 and r[1]>0 then //new green brick drawrectangle(wickbar,lowwick,wickbar+wicksize,downbox[1]) coloured(r[1],g[1],0) lowwick=low*100 highwick=0 endif //compute wicks at each new same brick if r>0 and r[1]>0 and lastdrawn<>wickbar then //new red brick if highwick>upbox[1] then drawrectangle(wickbar,highwick,wickbar+wicksize,upbox[1]) coloured(r[1],g[1],0) endif lastdrawn=wickbar lowwick=low*100 highwick=0 endif if r=0 and r[1]=0 and lastdrawn<>wickbar then //new green brick if lowwick<downbox[1] then drawrectangle(wickbar,lowwick,wickbar+wicksize,downbox[1]) coloured(r[1],g[1],0) endif lastdrawn=wickbar lowwick=low*100 highwick=0 endif //draw renko candlesticks drawcandle(upbox,upbox,downbox,downbox)coloured(r,g,0,min(transparency,255)) if showBG then backgroundcolor(r,g,0,min(transparency,255)) endif RETURN |
Share this
No information on this site is investment advice or a solicitation to buy or sell any financial instrument. Past performance is not indicative of future results. Trading may expose you to risk of loss greater than your deposits and is only suitable for experienced investors who have sufficient financial means to bear such risk.
ProRealTime ITF files and other attachments :
Find other exclusive trading pro-tools on ![]()
PRC is also on YouTube, subscribe to our channel for exclusive content and tutorials


Hello Nicolas
de plus en plus remarquable comme indicateur, merci de ton apport et partage
Nouvelle approche en mode “scalping pur”, merci Nicolas pour cet indicateur qui va surement faire des émules !!!
Hi Nicolas, Great work here thanks. How do I enable auto mode for the brick drawing please?
With:
autoRenko=1 //automatic renko brick size based on 2 time ATR periods
autoVolume=1 //automatic volume size to allow new brick or not (override the “volumesize” setting) based on average of volume instead of fixed value
Thank you. I tried the following but it does plot but not as I’d expect.
//PRC_Renko Bricks Volumes | indicator
//19.02.2018
//Nicolas @ http://www.prorealcode.com
//Sharing ProRealTime knowledge
// https://www.prorealcode.com/topic/new-renko-system/
//—settings
transparency=50 //brick colours alpha
wicksize=1 //width of wicks
boxsize=0//(bricksize) //renko bricks size in points/pips
volumesize=0//(volch) //volume size setting to allow new brick
showBG=0 //background color (true/false)
autoRenko=1 //automatic renko brick size based on 2 time ATR periods
autoVolume=1 //automatic volume size to allow new brick or not (override the “volumesize” setting) based on average of volume instead of fixed value
//—end of settings
if autoRenko=1 then
size=averagetruerange[14]*2
else
once size=boxsize*pointsize
endif
if autoVolume then
volumesize=average[1000](volume)*10
endif
once upbox = close
once downbox = close – (boxsize*pointsize)
once lowwick = close*100
volumesum = volumesum+volume
IF close > upbox + size and volumesum-lastvolume>=volumesize THEN
lastvolume = volumesum
upbox = upbox + size
downbox = downbox + size
r=0
g=200
begin=barindex
highwick=close
wickbar=barindex-round((barindex-begin[1])/2)
ELSIF close =volumesize THEN
lastvolume = volumesum
upbox = upbox – size
downbox = downbox – size
r=200
g=0
begin=barindex
wickbar=barindex-round((barindex-begin[1])/2)
ENDIF
//saving current high/low
highwick=max(high,highwick)
lowwick=min(low,lowwick)
//compute wicks at each new contrarian brick
if r>0 and r[1]=0 then
//new red brick
drawrectangle(wickbar,highwick,wickbar+wicksize,upbox[1]) coloured(r[1],g[1],0)
lowwick=low*100
highwick=0
endif
if r=0 and r[1]>0 then
//new green brick
drawrectangle(wickbar,lowwick,wickbar+wicksize,downbox[1]) coloured(r[1],g[1],0)
lowwick=low*100
highwick=0
endif
//compute wicks at each new same brick
if r>0 and r[1]>0 and lastdrawnwickbar then
//new red brick
if highwick>upbox[1] then
drawrectangle(wickbar,highwick,wickbar+wicksize,upbox[1]) coloured(r[1],g[1],0)
endif
lastdrawn=wickbar
lowwick=low*100
highwick=0
endif
if r=0 and r[1]=0 and lastdrawnwickbar then
//new green brick
if lowwick<downbox[1] then
drawrectangle(wickbar,lowwick,wickbar+wicksize,downbox[1]) coloured(r[1],g[1],0)
endif
lastdrawn=wickbar
lowwick=low*100
highwick=0
endif
//draw renko candlesticks
drawcandle(upbox,upbox,downbox,downbox)coloured(r,g,0,min(transparency,255))
if showBG then
backgroundcolor(r,g,0,min(transparency,255))
endif
RETURN
working now, sorry for the bother
BONJOUR,
Félicitations pour cet indicateur. Avez-vous une idée de comment créer une stratégie qui dirait que :
Achat lorsque la brique se dessine vers le haut avec clôture de position lorsque la brique change d’orientation en direction du bas et inversement avec Short lorsque la brique se dessine vers le bas et TP lorsque la brique commence à s’inverser ?
Je pense que ça a déjà été codé quelque part sur le forum. Dans la négative merci d’ouvrir un nouveau sujet spécifique.
@David29 … did you ever find a Strategy based on above Indicator?
@Nicolas Hi I get an error on line 61: one of the following characters would be more suitable than “drawrectangle”: ENDIF, how do you fix it?
Bonjour Nicolas et merci pour cet indicateur très intéressant. Si je ne m’intéresse qu’à la valeur de upbox et downbox est-ce que je peux me contenter du début seulement ou est-ce que tout le code est obligatoire ? Aussi est-ce que cet indicateur permet de backtester sur des bougies standards en utilisant le renko comme critère d’achat et en calculant les valeurs d’entrée (prix) en bougies standard ? Merci beaucoup
Bonjour Nicolas
merci pour ton partage. Je débute avec ProBuider et tes sources me son d’une très grande aide.
Cordialement.
Michel
Bonjour, ce message s’adresse à Nicolas puisqu’il est le spécialiste de la programmation sur PRT.
Je suis nouveau et m’interesse aux Renkop pour mes graphiques.
Mon souci est que par exemple lorsque je créé un programme pour qu’il m’affiche une fleche montante au croissement de moynennes mobiles
à la hausse, je pense qu’il prend les données du graphe renko et c’est bien car c’est ce que je voulais, alors que si j’utilise le même programme dans un screener
pour sélectionner les instruments qui ont se croisements de MM, le système se base sur le graphe en Prix.
Alors, comment faire dans un screnner pour lui dire de calculer tous les indicateurs dans ce programme en utilisant le chart Renko ?
Si vous avez la réponse ?
En vous remerciant et bonne journée
Les graphiques décorrélés du temps ne sont pas compatibles avec ProScreener. Pour ce cas en particulier, je suggère de créer une alerte via l’outil des alertes de la plateforme.
Bonjour à tous et à toutes, quelqu’un d’autre aurai-til la réposne à ma question ci-dessus ?
Comment faire un screener en se basant sur un graphique en Renko ?
En vous remerciant e tbonne journée.
Merci beaucoup Nicolas. Existe t’il un petit programme qui permet de tracer sur la graphe en prix, exactement la même chose que lorsqu’on choisi la représentation Renko dans PRT ? Encore merci et bonne journée à tous et à toutes.
Oui il y a celui ci: https://market.prorealcode.com/product/prt-renko/?lang=fr
Bonjour Nicolas, j’ai une question technique à te poser. Je visualise souvent le cours en RENKO sur la plateforme PRT, or, quelque fois, par exemple on voit 1 ou 2 cubes apparaitre, puis 1 seconde après disparaitre. C’est dû à quoi exactement ? Le cube renko ne s’affiche que définitivement sur le graphe si quel évènement se produit ? Merci et bonne journée.