Good Day Everyone
Apologies for being so scarce lately, I am finishing up some things before pursuing algorithmic trading on a full-time basis starting at the end of this year.
I suppose I will be more active on the forum from next year.
What I wanted to share with you though is a new concept of Renko that look at the relationship and confluence of moving averages based on pure price Renko and volume Renko.
In other word using Renko blocks not only for price but also for volume (i.e. 1000 contracts = 1 Renko volume block)
I am aware of a very large scale future trader who makes use of this concept VERY successfully.
As I understand he is calculating the moving averages of both the price and volume Renko bars and then use some logic based on the relationship of these two moving averages to trigger his trades.
Further, I am aware that he is trading on a very small timeframe, 1min or maybe as small as ticks as he is executing up to 30 odd trades a day.
Concerning Renko block size I am unsure of what he is using but can suggest some ATR as a starting point.
@Nicolas, are you maybe aware of such a strategy to fill some gaps in my description?
That is very interesting juanj! Will be following this post to see what happens 🙂 Personally i think as a retail-trader, going below 1 min timeframe must be pretty hard to stay profitable seeing how spread usually what fucks your profits at that small timeframe.. I wonder if its possible to adapt it to a larger timeframe then > 1m.
@juanj
Using Ticks and Volumes: I’m in love with these 2 words 🙂
Renko blocks size using ATR value is already something very common, this is often called “auto renko”.
calculating the moving averages of both the price and volume Renko bars
Calculate the MA of Price and the MA of Volume, not the MA of Volume Renko bars?
It is only in ticks charts or any other non time dependent ones that this kind of relationship between 2 moving average calculated on rather different data should give some potential useful things.
Let us know if you have any other informations about the system itself or any tips about how the relationship is made?
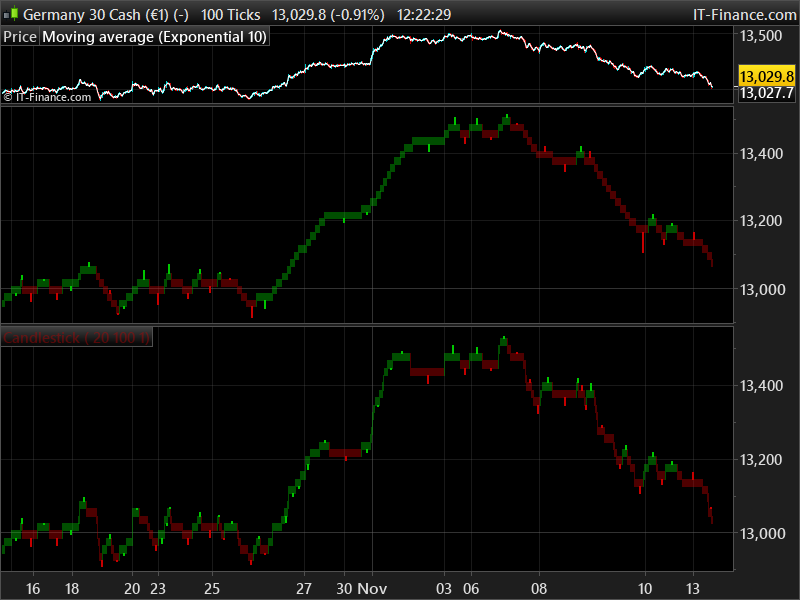
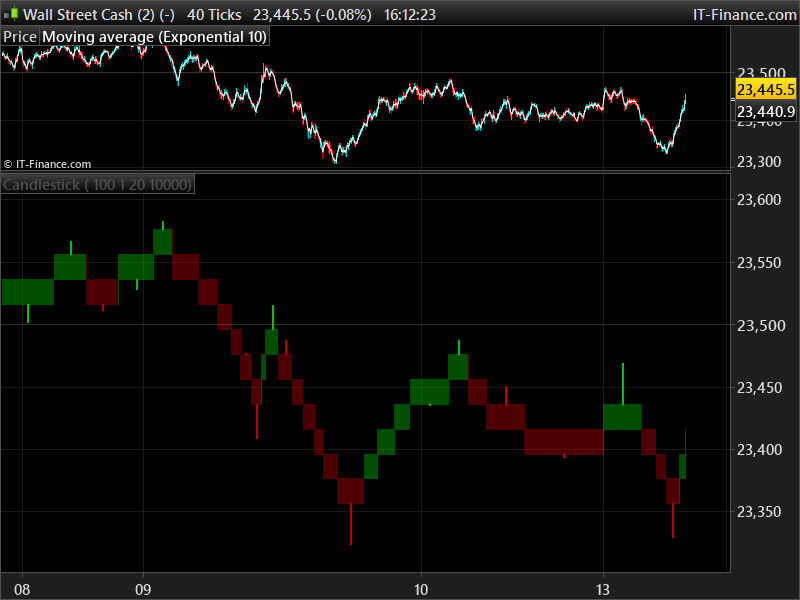
I made quickly this indicator (starting from this one: https://www.prorealcode.com/prorealtime-indicators/renko-bars-wicks-price-chart/)
- Above: the new indi with Volumes conditions to draw a new renko brick (10.000 Volumes for a 100 ticks chart on DAX), and if the price has moved 20 points.
- Below: the classic renko bricks, 20 points size.
I did not employed any moving average, but the chart is of course more “clear” because of avoiding the whipsaws of ranging market.
The next step is to define something more ‘dynamic’ for the Volumes threshold as well for the point size of bricks.
Love the idea, maybe you can share the code for the “improved” indicator as you have it so far. Or do you first want to work on the dynamic volumes threshold?
PFA the code of the indi.
I don’t know if it’s relevant or not and I think I’m far from your original idea 🙂
Because:
This is not renko, because the scale of the indicator is not the price scale, there is a difference between the real price and the indicator one. In fact there is new green or red block if Volumes have moved significantly and all my bricks have the same step (20 points in my example which mean nothing on screen, it could have been dots or a simple line changing color, it would have been the same).
Take a look yourself at this concept, in the meantime I’ll restart from scratch with a new and better idea, trying to follow your first description.
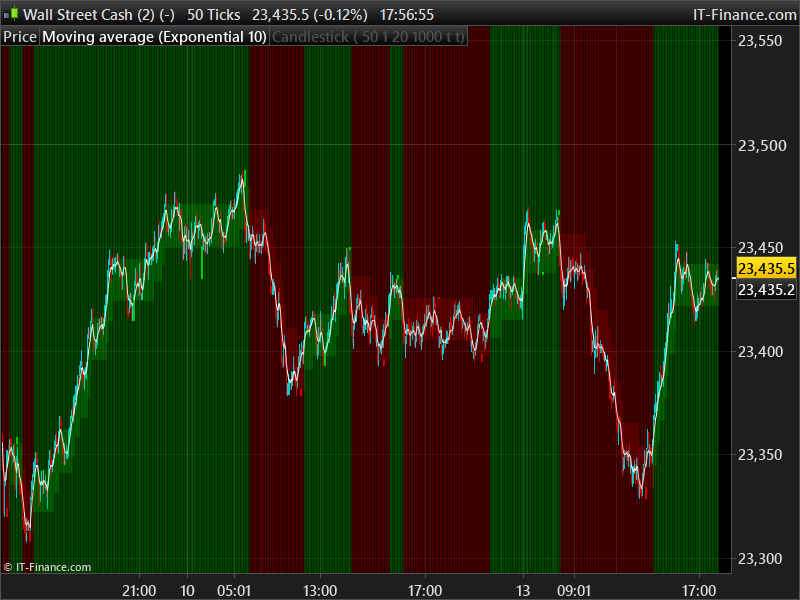
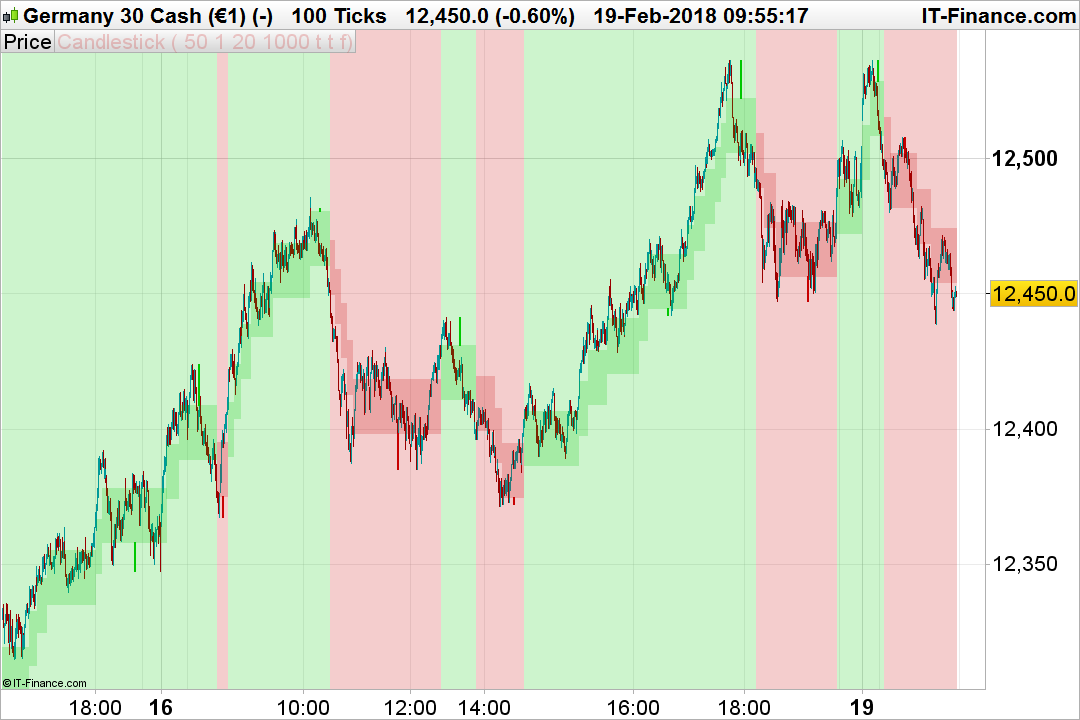
I’m still on the same version but with auto Renko (mode ON/OFF with 2*AverageTrueRange to determine bricks size) and overlay a color background or not to find the best suitable settings directly on the price chart.
Example on DJI, 50 ticks, and 1000 Volumes.
This is really starting to look very promising! Good job Nicolas!
I will try and see if I can get some more info on this guys strategy.
Okay so regarding the strategy, here are some more elements I found out;
He exclusively trades NASDAQ futures.
He uses a 10 Tick Renko chart (primary) a 15min Line-Break chart and a volume Renko chart
His volume Renko chart draws a new bar every approximate 1000 contracts
He looks for a higher low with a simple MACD cross from below the middle line with divergence for a long (there are some other unknown conditions as well).
He also considers the relationship (divergence maybe?) between volume moving averages and pure price moving averages.
@Nicolas, is this something we could maybe re-visit?
It appears you were working on something and then never posted it?
I added the last version to the Library, to drain more people here: Renko Bricks with Volumes
I think there might be interesting things to do with this kind of indicator, and even more so on decorrelated graphs of time, like tick charts. I think we should especially work the concept of Volume in this indicator to allow a better detection of the reversals based on this information, I think that there is material to find something of a little more relevant than what I have do for the “autoVolume” parameter. What do you think ?
I like where this is going! But getting back to the strategy described above;
Maybe we should start with two separate sets of bricks, one for price (based on ticks) and one for volume.
We then create a MACD based on a moving average of both the Price and Volume Bricks
How do you want to build new bricks only relying on Volumes? Since we don’t have separate Volumes informations for both the sellers and buyers.. 😐
I’m busy drawing up an example
So it is almost trading “divergences” between the Volumes and the price, but with their average differences such as using a normal MACD.
I think now that I’m considering price condition (price went up by 10 pips for instance) in the Volume renko bricks to create a new one, but it should only test a difference of price is superior to its last known price since last brick instead? I may have gone too far here .. 🙂