Introduction
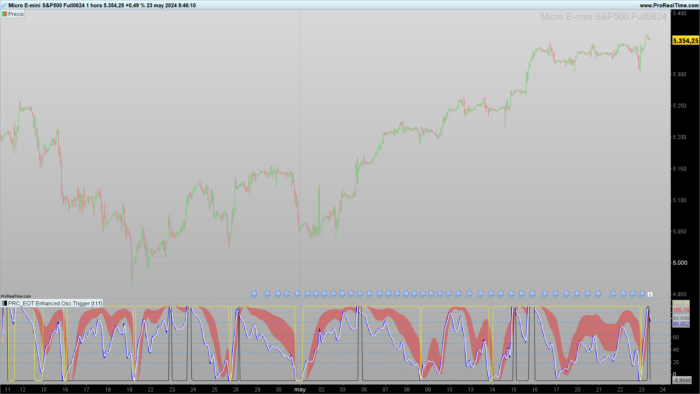
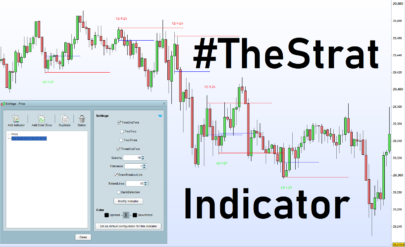
In this article, we will explore a complex indicator designed to provide detailed signals based on various technical analysis techniques. This indicator, called the “EOT Indicator” (Enhanced Oscillator Trigger), combines high-frequency filters, smoothing algorithms, and linear regression lines to offer a comprehensive market view.
Description of the Indicator
EOT Oscillator 1
The first oscillator (EOT 1) uses a high-pass filter to eliminate high-frequency cyclic components, followed by a supersmoother filter to reduce market noise. A fast attack-slow decay algorithm is employed to identify peaks and normalize the data.
EOT Oscillator 2
The second oscillator (EOT 2) follows a similar process to the first but with parameters adjusted to detect different market frequencies. It uses a high-pass filter, a supersmoother filter, and a fast attack-slow decay algorithm to provide a second layer of analysis.
EOT Oscillator 3
The third oscillator (EOT 3) introduces additional variation in smoothing and filtering parameters, allowing for even more detailed detection of market trends and reversals. This oscillator uses similar logic to the first two but with specific adjustments to complement their results.
LSMAWT Smoothing Filter
The LSMAWT (Least Squares Moving Average Weighted Trend) smoothing filter combines multiple data sources and uses a linear regression moving average to smooth market signals. This filter helps to eliminate noise and highlight the most relevant trends.
Configuration and Parameters
The EOT Indicator allows for high customization through various parameters that can be adjusted according to user preferences. Below are the main parameters and their functionalities:
- squared: Activates or deactivates the square line.
- showfib: Shows or hides Fibonacci lines.
- lpperiod, lpperiod2, lpperiod3: Smoothing periods for each oscillator.
- k1, k2, k12, k22, k13, k33: Adjustment coefficients for each oscillator.
- esize, esize2, esize3: Oscillator size.
- ey, ey2, ey3: Y-axis adjustment for each oscillator.
- trigno: Trigger length for signals.
- n1, n2, n3, n4, n5: Time and regression parameters for the LSMAWT filter.
- smalen, lsmaline: Smoothing configuration for the LSMA lines.
Practical Applications
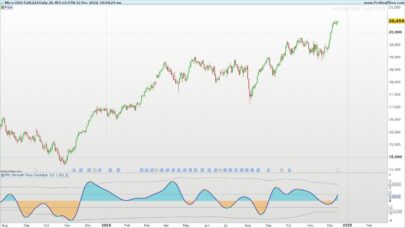
The EOT Indicator can be used in various trading situations to identify possible entry and exit points. By combining multiple oscillators and filters, this indicator offers a detailed market view, helping traders make informed decisions. Here are some practical applications:
Trend Reversal Detection:
- EOT 1, EOT 2, and EOT 3 allow identifying potential trend reversal points. When the normalized oscillator value crosses certain predefined levels, it may indicate an imminent trend reversal.
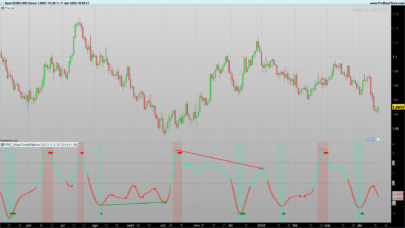
Entry and Exit Confirmation:
- Fibonacci lines and entry/exit signals help confirm optimal points to open or close positions. This is especially useful in smaller time frames, such as 1-hour charts.
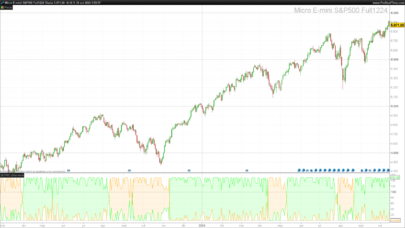
Market Cycle Analysis:
- Using different smoothing and filtering parameters, the indicator can analyze market cycles of various durations, providing a deeper understanding of market dynamics.
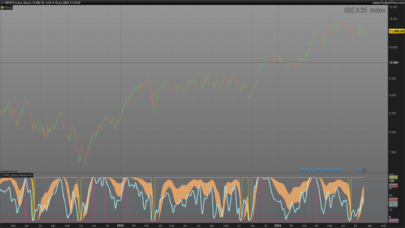
Market Noise Filter:
- The LSMAWT smoothing filter eliminates market noise, allowing traders to focus on the most significant trends and make decisions based on clearer data.
Conclusion
The EOT Indicator is a powerful and versatile tool for advanced technical analysis. Its ability to combine multiple oscillators and smoothing filters makes it ideal for detecting trend reversals, confirming entries and exits, and analyzing market cycles. By adjusting the parameters, traders can customize the indicator to suit their specific needs and improve their trading strategy. With its comprehensive and detailed approach, the EOT Indicator is a valuable addition for any trader looking to enhance their market decisions.
Code
|
1 2 3 4 5 6 7 8 9 10 11 12 13 14 15 16 17 18 19 20 21 22 23 24 25 26 27 28 29 30 31 32 33 34 35 36 37 38 39 40 41 42 43 44 45 46 47 48 49 50 51 52 53 54 55 56 57 58 59 60 61 62 63 64 65 66 67 68 69 70 71 72 73 74 75 76 77 78 79 80 81 82 83 84 85 86 87 88 89 90 91 92 93 94 95 96 97 98 99 100 101 102 103 104 105 106 107 108 109 110 111 112 113 114 115 116 117 118 119 120 121 122 123 124 125 126 127 128 129 130 131 132 133 134 135 136 137 138 139 140 141 142 143 144 145 146 147 148 149 150 151 152 153 154 155 156 157 158 159 160 161 162 163 164 165 166 167 168 169 170 171 172 173 174 175 176 177 178 179 180 181 182 183 184 185 186 187 188 189 190 191 192 193 194 195 196 197 198 199 200 201 202 203 204 205 206 207 208 209 210 211 212 213 214 215 216 217 218 219 220 221 222 223 224 225 226 227 228 229 230 231 232 233 234 235 236 237 238 239 240 241 242 243 244 245 246 247 248 249 250 251 252 253 254 255 |
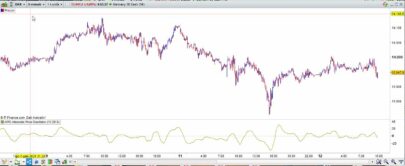
//-------------------------------------------------------------// //PRC_EOT Enhanced Oscillator Trigger //version = 0 //15.03.24 //Iván González @ www.prorealcode.com //Sharing ProRealTime knowledge //-------------------------------------------------------------// //-----Inputs--------------------------------------------------// //squared = 1 //Square line? //showfib = 1 //Show fibonacci? //showlsma=0 //Show LSMA? //---EOT 1 Main Oscilator lpperiod = 6 //Quotient k1 = 0 // K1 k2 = 0.3 esize = 60 // Size ey = 50 //Y axis trigno = 2 //trigger length //---EOT 2 lpperiod2 = 27 // k12 = 0.8 k22 = 0.3 esize2 = 60 ey2 = 50 //---EOT 3 lpperiod3 = 11 // k13 = 0.99 k33 = k13*(-1) esize3 = 60 ey3 = 50 //---LSMAWT n1 = 9 //WT Master n2 = 6 //time 1 n3 = 3 //time 2 n4 = 21 //LSMA 1 n5 = 0 //LSMA 2 smalen = 2 lsmaline= 200 //LSMA long //-------------------------------------------------------------// if squared then k13 = 0.9999 k33 = -0.9999 endif //-------------------------------------------------------------// //-----Fibonacci Levels----------------------------------------// if showfib then DRAWHLINE(84) coloured(33, 150, 243,50)style(dottedline) DRAWHLINE(64) coloured(33, 150, 243,50)style(dottedline) DRAWHLINE(50) coloured(33, 150, 243,50)style(dottedline) DRAWHLINE(36) coloured(33, 150, 243,50)style(dottedline) DRAWHLINE(18) coloured(33, 150, 243,50)style(dottedline) endif //-------------------------------------------------------------// //-----EOT 1 Calculation---------------------------------------// //vars pi = 2 * asin(1) if barindex < 2 then alpha1 = 0.00 HP = 0.00 a1 = 0.00 b1 = 0.00 c1 = 0.00 c2 = 0.00 c3 = 0.00 Filt = 0.00 Peak = 0.00 X = 0.00 Quotient1 = 0.00 Quotient2 = 0.00 else //highpass filter cyclic components //whose periods are shorter than 100 bars alpha1 = (cos(0.707*2*pi/100)+sin(0.707*2*pi/100)-1)/cos(0.707*2*pi/100) hp = (1-alpha1/2)*(1-alpha1/2)*(close-2*close[1]+close[2])+2*(1-alpha1)*hp[1]-(1-alpha1)*(1-alpha1)*hp[2] //supersmoother filter a1 = exp(-1.414*3.1416/lpperiod) b1 = 2*a1*cos(1.414*pi/lpperiod) c2 = b1 c3 = -a1*a1 c1 = 1-c2-c3 filt = c1*(hp+hp[1])/2+c2*filt[1]+c3*filt[2] //fast attack-slow decay algotithm peak = 0.991*peak[1] if abs(filt)>peak then peak=abs(filt) else peak=peak endif //normalizad roffing filter if peak<>0 then x=filt/peak else x=x endif Quotient1 = (x+k1)/(k1*x+1) Quotient2 = (x+k2)/(k2*x+1) endif //-------------------------------------------------------------// //-----EOT 2 Calculation---------------------------------------// if barindex < 2 then alpha1222 = 0.00 HP2 = 0.00 a12 = 0.00 b12 = 0.00 c12 = 0.00 c22 = 0.00 c32 = 0.00 Filt2 = 0.00 Peak2 = 0.00 X2 = 0.00 else alpha1222 = (cos(.707 * 2 * pi / 100) + sin(.707 * 2 * pi / 100) - 1) / cos(.707 * 2 * pi / 100) HP2 = (1 - alpha1222 / 2) * (1 - alpha1222 / 2) * (close - 2 * close[1] + close[2]) + 2 * (1 - alpha1222) * HP2[1] - (1 - alpha1222) * (1 - alpha1222) * HP2[2] //SuperSmoother Filter a12 = EXP(-1.414 * 3.1416 / LPPeriod2) b12 = 2 * a12 * cos(1.414 * pi / LPPeriod2) c22 = b12 c32 = -a12 * a12 c12 = 1 - c22 - c32 Filt2 = c12 * (HP2 + HP2[1]) / 2 + c22 * Filt2[1] + c32 * Filt2[2] //Fast Attack - Slow Decay Algorithm Peak2 = .991 * Peak2[1] if abs(Filt2) > Peak2 then Peak2 = abs(Filt2) else Peak2 = peak2 endif //Normalized Roofing Filter if Peak2 <> 0 then X2 = Filt2 / Peak2 else X2 = X2 endif Quotient3 = (X2 + K12) / (K12 * X2 + 1) Quotient4 = (X2 + K22) / (K22 * X2 + 1) endif //-------------------------------------------------------------// //-----EOT 3 Calculation---------------------------------------// if barindex < 3 then alpha1333 = 0.12 HP3 = 0.00 a13 = 0.00 b13 = 0.00 c13 = 0.00 c33 = 0.00 c333 = 0.00 Filt3 = 0.00 Peak3 = 0.00 X3 = 0.00 Quotient5 = 0.00 Quotient6 = 0.00 else alpha1333 = (cos(.707 * 2 * pi / 100) + sin(.707 * 2 * pi / 100) - 1) / cos(.707 * 2 * pi / 100) HP3 = (1 - alpha1333 / 3) * (1 - alpha1333 / 2) * (close - 2 * close[1] + close[2]) + 2 * (1 - alpha1333) * HP3[1] - (1 - alpha1333) * (1 - alpha1333) * HP3[2] //SuperSmoother Filter a13 = exp(-1.414 * 3.1416 / LPPeriod3) b13 = 2 * a13 * cos(1.414 * pi / LPPeriod3) c33 = b13 c333 = -a13 * a13 c13 = 1 - c33 - c333 Filt3 = c13 * (HP3 + HP3[1]) / 2 + c33 * Filt3[1] + c333 * Filt3[2] //Fast Attack - Slow Decay Algorithm Peak3 = .991 * Peak3[1] if abs(Filt3) > Peak3 then Peak3 = abs(Filt3) else Peak3 = peak3 endif //Normalized Roofing Filter if Peak3 <> 0 then X3 = Filt3 / Peak3 else X3 = peak3 endif Quotient5 = (X3 + K13) / (K13 * X3 + 1) Quotient6 = (X3 + K33) / (K33 * X3 + 1) line1 = -0.9 endif //-------------------------------------------------------------// //-----LSMAWT Calculation--------------------------------------// //---Sources: src0 = open src1 = high src2 = low src3 = close src4 = (high+low)/2 //hl2 src5 = (high+low+close)/3 //hlc3 src6 = (high+low+close+open)/4 //ohlc4 src7 = tr vol = volume //---Indi Functions tci1 = average[n2,1]((src5-average[n1,1](src5))/(0.025*average[n1,1](abs(src5-average[n1,1](src5))))) + 50 if src5-src5[1]<=0 then auxmf1 = 0 else auxmf1 = src5 endif if src5-src5[1]>=0 then auxmf2 = 0 else auxmf2 = src5 endif mf1 = 100.0 - 100.0 / (1.0 + summation[n3](volume * auxmf1) / summation[n3](volume * auxmf2)) //---rsi rsi1 = rsi[n3](src5) wt1 = (tci1+mf1+rsi1)/3 wt2 = average[6](wt1) //---LSMA wt3 = LinearRegression[n4](wt1) wt4 = average[n3,1]((wt1-wt2)*2+50) trig = average[smalen](wt3) q3 = Quotient3 * esize + ey q4 = Quotient4 * esize + ey colorbetween(q3,q4,"red",90) //-------------------------------------------------------------// //-----Plotting------------------------------------------------// //-------------------------------------------------------------// //-----plot EOT q1 = Quotient1 * esize + ey q2 = Quotient2 * esize + ey trigger = average[trigno](q1) //-------------------------------------------------------------// //-----PLOT LSMAWT if wt2 < 20 then ext1 = trigger + 9 elsif wt2 > 80 then ext1 = trigger - 9 else ext1 = undefined endif if showlsma then lsma = LinearRegression[lsmaline ](wt3) else lsma = undefined endif q5 = Quotient5 * esize2 + ey2 q6 = Quotient6 * esize2 + ey2 //-------------------------------------------------------------// return q1 as "EO1"coloured("blue")style(line,2), trigger as "Trigger EO1"coloured("white")style(line,2),q3 as "EO2 q3"coloured("red",50), q4 as "EO2 q4"coloured("red",50),q6 as "EO3 q6"style(line)coloured("black"),q5 as "EO3 q5"style(line)coloured("yellow"), lsma |
Share this
No information on this site is investment advice or a solicitation to buy or sell any financial instrument. Past performance is not indicative of future results. Trading may expose you to risk of loss greater than your deposits and is only suitable for experienced investors who have sufficient financial means to bear such risk.
ProRealTime ITF files and other attachments :
Find other exclusive trading pro-tools on ![]()
PRC is also on YouTube, subscribe to our channel for exclusive content and tutorials


Ciao, il tuo lavoro è incredibile, ti chiedo una cortesia è possibile veder un grafico con le indicazioni per capire meglio il funzionamento? grazie