

Red Green Breakout Probability
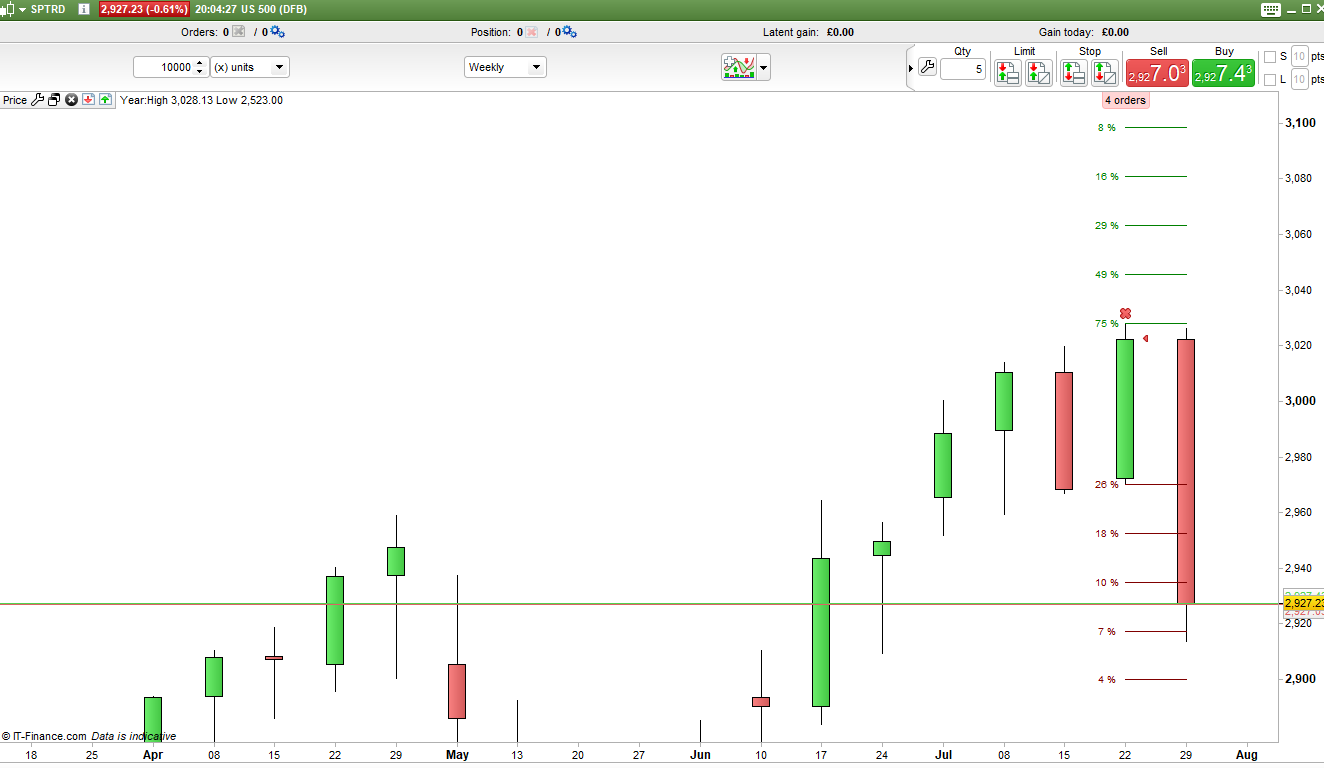
This indicator sets levels above and below the last closed candle and then calculates how many candles in the history managed to reach those levels. This is then displayed on the latest still forming candle as five lines below the previous low and five lines above the previous high with the percentage of candles that have reached this level in the past.
The results are calculated separately depending upon whether the previous candle was a red candle or a green candle.
The spacing of the lines can be altered using the step variable. So you might want to see how many red candles reached 5 pips, 10 pips etc above and below the previous high and low. Alternatively the spacing (and historical calculations) can be based on a percentage of the closing price. If ‘Percentage’ is set to anything other than zero then percentage spaced lines are used otherwise if it is set to zero the spacing is based on the ‘Step’ value.
It is also possible to set the start date for calculating the history. If the date is set to zero then it analyses all of the candles on the chart.
So for example if yesterday was a green candle we might see that history tells us that the high has been hit or passed 75% of the time after a green candle but the low only 33% of the time. We can then also see that the high plus 0.5% has been hit 50% of the time and the low minus 0.5% only 21% of the time and so on.
Hopefully this indicator can help with understanding the probability of a breakout or assist in setting stop loss levels based on where a price is most likely or least likely to go.
I advise downloading the ITF file and importing it to get full functionality.
//Red Green Breakout Probability
//By Vonasi
//20190802

defparam drawonlastbaronly = true

//step = 3
//percentage = 0

if opendate > startdate or startdate = 0 then

if percentage > 0 then
step = close * (percentage/100)
endif

green = close[1] > open[1]
red = close[1] < open[1]

x = 0
hh = high > high[1] + x
ll = low < low[1] - x

if green then
gtotal = gtotal + 1
endif

if red then
rtotal = rtotal + 1
endif

if green and hh then
g0hh = g0hh + 1
endif

if red and hh then
r0hh = r0hh + 1
endif

if green and ll then
g0ll = g0ll + 1
endif

if red and ll then
r0ll = r0ll + 1
endif

g0hhperc = (g0hh/gtotal)*100
r0hhperc = (r0hh/rtotal)*100
g0llperc = (g0ll/gtotal)*100
r0llperc = (r0ll/rtotal)*100


x = x + step
hh = high > high[1] + x
ll = low < low[1] - x

if green and hh then
g1hh = g1hh + 1
endif

if red and hh then
r1hh = r1hh + 1
endif

if green and ll then
g1ll = g1ll + 1
endif

if red and ll then
r1ll = r1ll + 1
endif

g1hhperc = (g1hh/gtotal)*100
r1hhperc = (r1hh/rtotal)*100
g1llperc = (g1ll/gtotal)*100
r1llperc = (r1ll/rtotal)*100


x = x + step
hh = high > high[1] + x
ll = low < low[1] - x

if green and hh then
g2hh = g2hh + 1
endif

if red and hh then
r2hh = r2hh + 1
endif

if green and ll then
g2ll = g2ll + 1
endif

if red and ll then
r2ll = r2ll + 1
endif

g2hhperc = (g2hh/gtotal)*100
r2hhperc = (r2hh/rtotal)*100
g2llperc = (g2ll/gtotal)*100
r2llperc = (r2ll/rtotal)*100


x = x + step
hh = high > high[1] + x
ll = low < low[1] - x

if green and hh then
g3hh = g3hh + 1
endif

if red and hh then
r3hh = r3hh + 1
endif

if green and ll then
g3ll = g3ll + 1
endif

if red and ll then
r3ll = r3ll + 1
endif

g3hhperc = (g3hh/gtotal)*100
r3hhperc = (r3hh/rtotal)*100
g3llperc = (g3ll/gtotal)*100
r3llperc = (r3ll/rtotal)*100


x = x + step
hh = high > high[1] + x
ll = low < low[1] - x

if green and hh then
g4hh = g4hh + 1
endif

if red and hh then
r4hh = r4hh + 1
endif

if green and ll then
g4ll = g4ll + 1
endif

if red and ll then
r4ll = r4ll + 1
endif

g4hhperc = (g4hh/gtotal)*100
r4hhperc = (r4hh/rtotal)*100
g4llperc = (g4ll/gtotal)*100
r4llperc = (r4ll/rtotal)*100


g0hhperc = round(g0hhperc)
r0hhperc = round(r0hhperc)
g0llperc = round(g0llperc)
r0llperc = round(r0llperc)

g1hhperc = round(g1hhperc)
r1hhperc = round(r1hhperc)
g1llperc = round(g1llperc)
r1llperc = round(r1llperc)

g2hhperc = round(g2hhperc)
r2hhperc = round(r2hhperc)
g2llperc = round(g2llperc)
r2llperc = round(r2llperc)

g3hhperc = round(g3hhperc)
r3hhperc = round(r3hhperc)
g3llperc = round(g3llperc)
r3llperc = round(r3llperc)

g4hhperc = round(g4hhperc)
r4hhperc = round(r4hhperc)
g4llperc = round(g4llperc)
r4llperc = round(r4llperc)

drawsegment(barindex[1],high[1],barindex,high[1]) coloured(0,128,0)
drawsegment(barindex[1],high[1]+step,barindex,high[1]+step) coloured(0,128,0)
drawsegment(barindex[1],high[1]+(step*2),barindex,high[1]+(step*2)) coloured(0,128,0)
drawsegment(barindex[1],high[1]+(step*3),barindex,high[1]+(step*3)) coloured(0,128,0)
drawsegment(barindex[1],high[1]+(step*4),barindex,high[1]+(step*4)) coloured(0,128,0)

drawsegment(barindex[1],low[1],barindex,low[1]) coloured(128,0,0)
drawsegment(barindex[1],low[1]-step,barindex,low[1]-step) coloured(128,0,0)
drawsegment(barindex[1],low[1]-(step*2),barindex,low[1]-(step*2)) coloured(128,0,0)
drawsegment(barindex[1],low[1]-(step*3),barindex,low[1]-(step*3)) coloured(128,0,0)
drawsegment(barindex[1],low[1]-(step*4),barindex,low[1]-(step*4)) coloured(128,0,0)

if green then
drawtext(" #g0hhperc#%             ",barindex-1,high[1],SansSerif,standard,10)coloured(0,128,0)
drawtext(" #g1hhperc#%             ",barindex-1,high[1]+step,SansSerif,standard,10)coloured(0,128,0)
drawtext(" #g2hhperc#%             ",barindex-1,high[1]+(step*2),SansSerif,standard,10)coloured(0,128,0)
drawtext(" #g3hhperc#%             ",barindex-1,high[1]+(step*3),SansSerif,standard,10)coloured(0,128,0)
drawtext(" #g4hhperc#%             ",barindex-1,high[1]+(step*4),SansSerif,standard,10)coloured(0,128,0)

drawtext(" #g0llperc#%             ",barindex-1,low[1],SansSerif,standard,10)coloured(128,0,0)
drawtext(" #g1llperc#%             ",barindex-1,low[1]-step,SansSerif,standard,10)coloured(128,0,0)
drawtext(" #g2llperc#%             ",barindex-1,low[1]-(step*2),SansSerif,standard,10)coloured(128,0,0)
drawtext(" #g3llperc#%             ",barindex-1,low[1]-(step*3),SansSerif,standard,10)coloured(128,0,0)
drawtext(" #g4llperc#%             ",barindex-1,low[1]-(step*4),SansSerif,standard,10)coloured(128,0,0)
endif

if red then
drawtext(" #r0hhperc#%             ",barindex-1,high[1],SansSerif,standard,10)coloured(0,128,0)
drawtext(" #r1hhperc#%             ",barindex-1,high[1]+step,SansSerif,standard,10)coloured(0,128,0)
drawtext(" #r2hhperc#%             ",barindex-1,high[1]+(step*2),SansSerif,standard,10)coloured(0,128,0)
drawtext(" #r3hhperc#%             ",barindex-1,high[1]+(step*3),SansSerif,standard,10)coloured(0,128,0)
drawtext(" #r4hhperc#%             ",barindex-1,high[1]+(step*4),SansSerif,standard,10)coloured(0,128,0)

drawtext(" #r0llperc#%             ",barindex-1,low[1],SansSerif,standard,10)coloured(128,0,0)
drawtext(" #r1llperc#%             ",barindex-1,low[1]-step,SansSerif,standard,10)coloured(128,0,0)
drawtext(" #r2llperc#%             ",barindex-1,low[1]-(step*2),SansSerif,standard,10)coloured(128,0,0)
drawtext(" #r3llperc#%             ",barindex-1,low[1]-(step*3),SansSerif,standard,10)coloured(128,0,0)
drawtext(" #r4llperc#%             ",barindex-1,low[1]-(step*4),SansSerif,standard,10)coloured(128,0,0)
endif
endif

return