LastManStanding Swing indicator

v10.3
LastManStanding Swing indicator

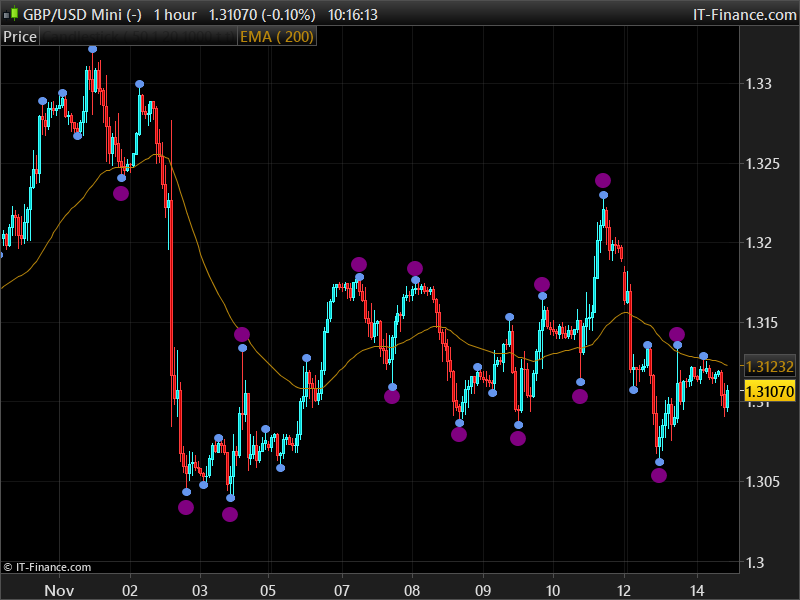
This indicator is about Dow’s theory, it detects the highs and lows of a trend to clearly identify trends or periods when the market is in range.
It has major points (based on a long-term calculation) and minor points (calculated on a short term). These periods are of course adjustable, it also includes a moving average of type and adjustable period to match your style of ‘swing trader’.

Converted from an MQL4 code, by a request in the Italian trading indicator’s forum.


Share this

Risk disclosure:

No information on this site is investment advice or a solicitation to buy or sell any financial instrument. Past performance is not indicative of future results. Trading may expose you to risk of loss greater than your deposits and is only suitable for experienced investors who have sufficient financial means to bear such risk.

ProRealTime ITF files and other attachments : How to import ITF files into ProRealTime platform?

PRC is also on YouTube, subscribe to our channel for exclusive content and tutorials

  1. swapping • 11/14/2017 #

    Merci Nicolas, voila encore un bon indicateur visuel pour les tendances…

  2. Genotik • 11/14/2017 #

    Un Indicateur bien pratique à intégré dans sa stratégie, Thanks ! 🙂

  3. DaxRider • 11/14/2017 #

    Thanks Nicolas
    Nice Job

  4. klaus • 11/14/2017 #

    Hi Nicolas,
    this indicator is repainting, is it?

    • Nicolas • 11/14/2017 #

      There’s no repainting indicator in prorealtime. But this one plots the points afterwards of course. There’s always a delay to be sure a higher high is really one!

  5. HerveS_67 • 11/14/2017 #

    Attention, regardez bien la construction du code !!!
    Les points bleu s’affichent entre barindex-1 & barindex-10
    Les points violet s’affichent entre barindex-1 & barindex-26
    Donc décalage…

  6. wintreb • 11/14/2017 #

    Un outil très visuel et utile
    Merci

  7. darbes • 11/14/2017 #

    Hi Nicolas
    How could I use the indicator in a strategy ? Coding do not recognize the indicator.
    Tku
    JC

    • Nicolas • 11/14/2017 #

      What do you want to do exactly? Because dots are plotted afterwards..

  8. rama • 11/14/2017 #

    I want to place buy or sell order just after the last man , what is the code to use ? i tried to place buy or sell instead of drawtext it is not working

    • Nicolas • 11/14/2017 #

      But it should, please open a new specific topic in the ProOrder automatic trading forum.

  9. Jean-Claude REGIS • 11/14/2017 #

    Bonjour
    Quel est le retard d’affichage des points mineurs et majeurs ?
    Merci de votre rep Cordialement

    • Nicolas • 11/14/2017 #

      Désolé, je ne comprends pas la question 🙂

  10. tjrp_fr • 11/14/2017 #

    Très intéressant, merci !

  11. niroy2000 • 11/14/2017 #

    Please help the above is not working for me

    • Nicolas • 11/14/2017 #

      what is not working please? attach the indicator on your price chart and it should work correctly.

  12. Admiral • 11/14/2017 #

    Do the dots appear on the candle close or after a certain amount of candles?

    • Nicolas • 11/14/2017 #

      Yes that’s right, they are painted backwards.

  13. Louloute • 11/14/2017 #

    Bonjour Nicolas,
    Je ne comprends pas bien la fonction des 2 lignes ci-dessous, pourriez-vous m’expliquer brièvement ?
    hhminorprice=0
    llminorprice=close*1000
    Pourquoi ne pas partir avec les valeurs des premières chandelles ?
    Merci.

  14. claudiofred • 11/14/2017 #

    Bonjour Nicolas,
    merci encore pour ce super indicateur. se demander s’il est possible d’écrire un screener basé sur cet indicateur.
    merci beaucoup.

    • Nicolas • 11/14/2017 #

      Screener déjà présent sur le forum ici: https://www.prorealcode.com/topic/indicador-lastmanstanding-swing/

avatar
Register or

Likes

avatar avatar avatar avatar avatar avatar avatar avatar avatar avatar avatar avatar avatar avatar avatar avatar

+14 more likes

Related users ' posts
kats bONSOIR Est ce normal que les droites se démultiplient en plusieurs droites quelle differe...
kats j ai fait une copie d'ecran mais je ne sais pas comment l'envoyer sur le site
Gaspare Ciao Ivan si puo' inserire una strategia su questo indicatore per ottimizzare le variabil...
jacquesgermain sì da aggiungere
Maik2404 auf welchen Wert muss ich die Kompresionsperiode stellen?
jacquesgermain — Période de compression : ce paramètre détermine la période de rétrospection utilisée pour ...
philippe59139 Bravo super travail
Fgats quelques explications en Français ici : Some explanations in French here : https://www.p...
Nicolas Merci pour cette contribution, j'apprécie ! :)
Fgats Merci Nicolas pour ces encouragements et merci aussi pour le commentaire en Anglais accompa...
Nicolas
2 years ago
ipbvba Quelqu'un a t il pu créer un screener pour cet indicateur, cela serait très utile. Merci bea...
Nicolas Je pense que le code ci-dessous doit fonctionner pour un screener: //PRC_Wick Pressure | i...
Nicolas la dernière ligne doit être: screener[signal>0 or signal<0](signal)
Finning Hi JuanJ, just a question about the tollerance*pointsize. I know what it is/what it does (in...
JOKAMAURICE Hi I am looking to number bars in a chart to ease analysis. Any idea if a program has been d...
goldenfish67 Hi guys just copied the code but I keep getting an error message: "Line 15 one of the fo...
Roland57800 Bonjour Noobywan, si je comprends bien l'utilisation de ce code que je trouve particulièr...
Noobywan Bonjour, quand la question a été posée dans le forum à celui qui avait fait la requête en am...
Fabian This Code draws only a retangle if the condition has been confirmed and NOT before (in that ...
idunnomuch IS this working in the latest version of prorealtime? I get the indicator, but not over my c...
bernardmorel egalement apparait en dessous du graphique mais vide
bernardmorel Bonjour est t il possible de remettre en ligne the strat car il y a une indication qui d...
Manu L. Bonjour Nicolas, j'ai créé un screener avec l'aide à la prog en TF weekly mais je voudrai...
wtangsiri C'est exactement le même signal que donne le croisement et le décroisement de deux EMA (7 et...
PHAN100 bonjour, j'ai un bug sur le programme recopié prorealtime me dit qu'il y a un problème à ...
PHAN100 bonjour, bravo à l'auteur pour cet indicateur visuel sur le graphique, il nous reste à va...
Fabian Hi Thomas, thanks for your explanations. Which indicator do you use in the screenshot ...
Thomas Thats On Balance Volume and Bollinger or SMA or what you want. It shows me the volume flow. ...
bertrandpinoy @MAKSIDE I would be grateful if you send me your version. have a nice day
yeoreum Thank you very much for the screener, it reminds me on Minervini VCP. How to change th...
reecet any codes like this but in minutes and hours rather than days?
PHAN100 bonjour, je viens de tester ce screener, je constate une anomalie...il ne renvoie pas l'e...
Oxxoz Re bonjour Vivien, Il me smeble que 3 mois, c'est 60 séances. Cordialement,
Vinks_o_7 thanks ...and It can be used on a monthly and weekly basis by changing just the duration in ...
nicko Many Thanks Viv. It looks good
Nokis Bonjour Vivien, Comment je peux faire pour adapter ton code afin: De cibler les sociétés q...
sam00075 I tried it today and it gave great results. So a big Thanks !
jimkn0pf Christopher, wie saehe denn die Formel ohne Kontrollkerze (3. Kerze) aus?

Top