







Perfect Trend Line
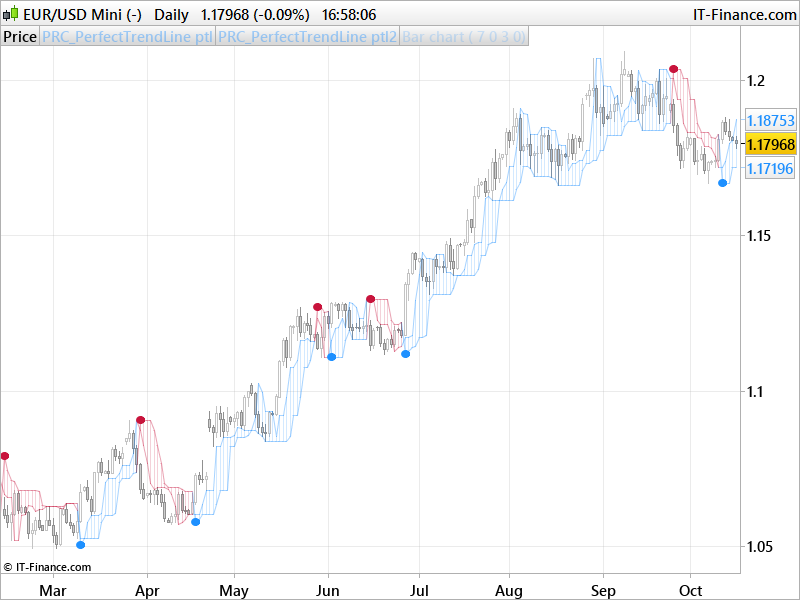
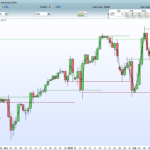
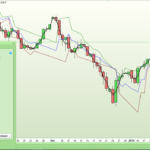
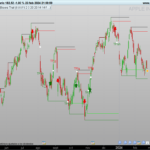
The Perfect Trend Line indicator act as a trend following indicator. It is simply made of 2 lines from highest high and lowest low of 2 different periods, one short and a longer one.
If the price breaches the longest line, it is a sign a of potential trend reversal, while if price is in the cloud made of these 2 lines, it is only a retracement and a potential price rebound in the same direction as the main trend.
Confirmation of trend reversal are highlighted with blue and red dots.
The cloud can be expanded with the SlowPipDisplace and the FastPipDisplace settings which must be set in points/pips values.
//PRC_PerfectTrendLine ptl | indicator
//16.10.2017
//Nicolas @ www.prorealcode.com
//Sharing ProRealTime knowledge
//converted from MT4 version (original author mladen)
//enhanced version by Nicolas

// --- settings
//SlowLength         = 7 // Slow length
//SlowPipDisplace    = 0 // Slow pip displace
//FastLength         = 3 // Fast length
//FastPipDisplace    = 0 // Fast pip displace
// --- end of settings

thigh1 = Highest[SlowLength](high)+ SlowPipDisplace*pointsize
tlow1  = Lowest[SlowLength](low)- SlowPipDisplace*pointsize
thigh2 = Highest[FastLength](high)+ FastPipDisplace*pointsize
tlow2  = Lowest[FastLength](low)- FastPipDisplace*pointsize

if barindex>2 then
 if Close>line1[1] then
  line1 = tlow1
 else
  line1 = thigh1
 endif
 if Close>line2[1] then
  line2 = tlow2
 else
  line2 = thigh2
 endif
endif

if (Close[0]<line1[0] and Close[0]<line2[0]) then
 trend =  1
endif
if (Close[0]>line1[0] and Close[0]>line2[0]) then
 trend = -1
endif
if (line1[0]>line2[0] or trend[0] =  1) then
 trena =  1
endif
if (line1[0]<line2[0] or trend[0] = -1) then
 trena = -1
endif
if trena<>trena[1] then
 if trena=1 then
  x = max(line1,line2)
  r=200
  g=20
  b=60
 else
  x = min(line1,line2)
  r=30
  g=144
  b=255
 endif
 drawtext("●",barindex,x,Dialog,Bold,10) coloured(r,g,b)
endif
drawbarchart(line1,line2,line1,line2) coloured(r,g,b,50)

return line1 coloured(r,g,b,100) style(line,1),line2 coloured(r,g,b,100) style(line,1)
Comments
You must be logged in to post a comment.

Bonjour Nicolas, suite a une de mes precedentes demande dans le forum indicateur, j'ai touve celui-ci pour creer le screener Perfect Line Trade https://www.prorealcode.com/topic/ayuda-screener-indicador-perfect-trend-line/#post-51291 J'ai teste ce matin et il m'a bien remonte les valeurs ayant eu un point bleu sur la journee d'hier. Ce soir, je teste et il me ressort les meme valeurs avec une journee de plus et pas de nouvelles alors que McPhy a un point bleu ajourd'hui ?! Un p'tit coup de main :-) Merci d'avance

* The edit didn't work on my previous comment. " but there is ">=" or "=" value 250 or 30 produced two alerts but nowhere near the dots..." should have read: but there is ">=" or "=" value. When I set fast trendline >= to value 250 or 30 it produced two alerts but nowhere near the dots...
Hello Nicolas, Re: alerts, you wrote: "and check in the alert tools if r is equal to 200 (red) (I changed mine to 250) or 30 (green)" But there is no "=," but there is ">=" or "=" value 250 or 30 produced two alerts but nowhere near the dots on my 3 tick chart? Pls see two arrow alerts at bottom price chart to the left nowhere near ptl dots: https://www.dropbox.com/s/0yxj8v1vdhpw7xf/ALERTSPERFECTTRENDLINE.png When the dots are formed there is no alert sound, so how do I express that within the alerts feature if I can't see "r" in the dropdown box?: (I have re-added the indicator to the price chart just to make sure that "r" is effective). https://www.dropbox.com/s/tm98dxlj5a88n9c/ALERTSPERFECTTRENDLINE2.png Also, when I go to Display/Alerts Status, now I don't see anyway of creating a new alert on a different chart by clicking within that chart? Alerts Status just opens up but I can't get a bell in the new second chart for another indicator/screener when I click on the chart? Cheers,




Hello Nicolas, thank you for the code of the 'perfect trend line' indicator. As a daytrader on the 10, 15 and 30 min charts it confirms the reversals very nice. One question. I trade several stocks and some indices. Is there a possibility that i can get a alert when a blue or red dot appears? thank you in advance kind regards, Sjoerd

Perfect Indicator. Thanks a lot. Hope i will get reach by using it :-)

Hi Nicolas, As per my previous message above, I mentioned that the red or blue dot is formed based on the current close or next close of candle stick? I have tested with 1 minute interval, it is based on current candle stick but when I change time interval to weekly, it looks like it is based on next candle stick or bar index. For example, I was pretty sure that IBEX ( Spain 35 cash index) at weekend when market was close, there wasn't any blue dot under a bar closed on 27 October . But this week when market opened and price move higher it shows blue dot under previous candle stick which is inconsistent with other time interval. Is here problem or issues under weekly interval? Thanks, Hamid

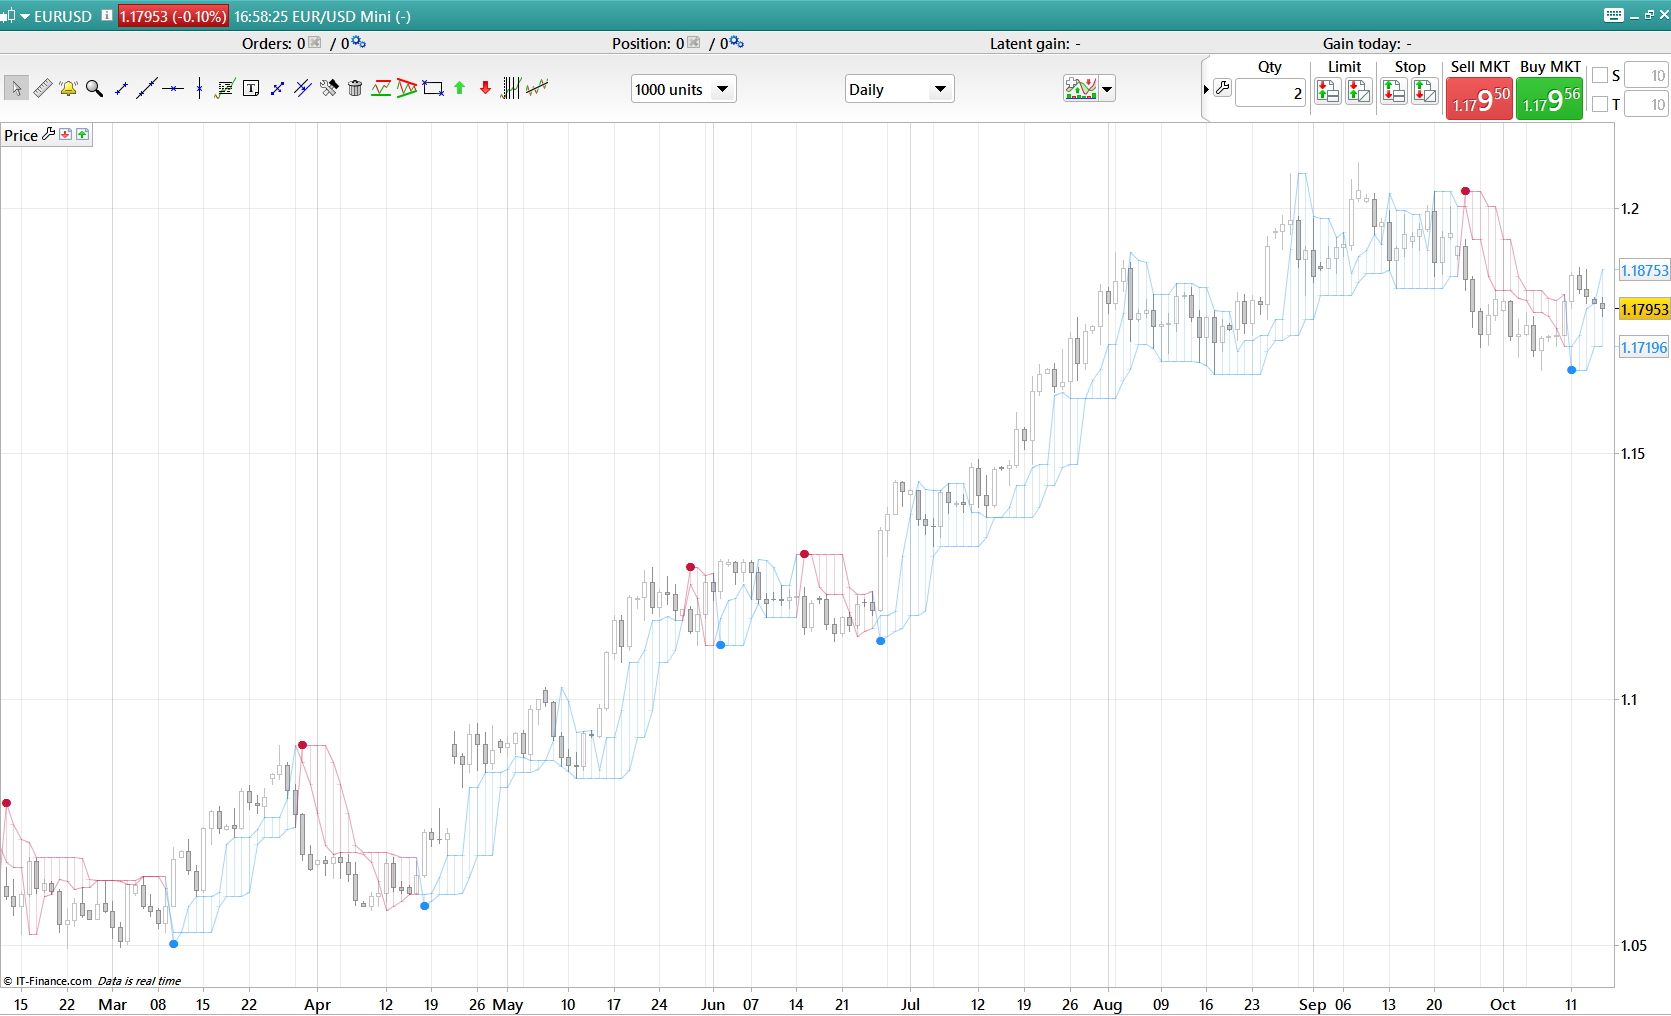
C'est selon moi le meilleur indicateur, que j'ai vu, si vous trouvez mieux dîtes moi car difficile de faire beaucoup mieux :D Mais je ne comprend pas exactement à quoi servent les lignes rouges et bleus ? (elle servent pour le signal, j'imagine, et font grosso modo allure de résistance et de support) mais est t il vraiment intéressant de les afficher? (ça pollue un peu le graph des fois) Merci d'avance !!