
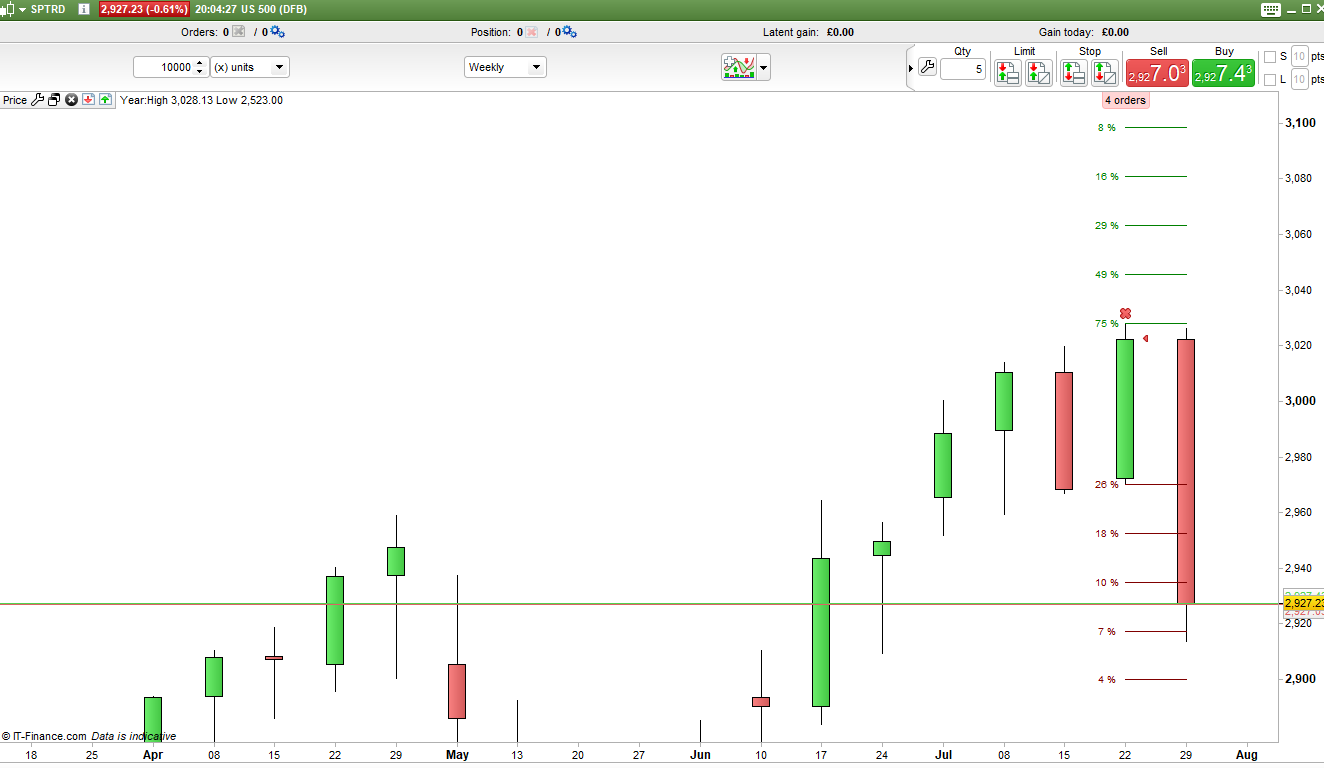
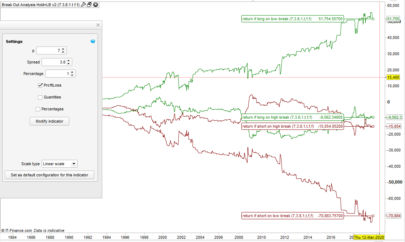
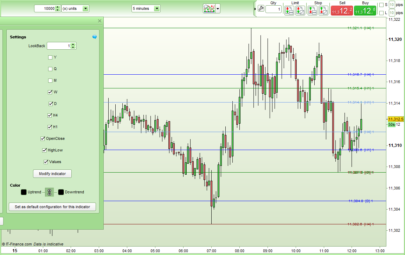
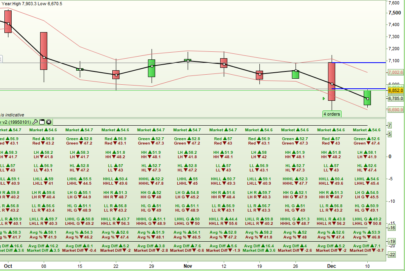
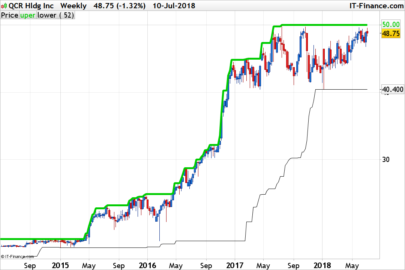
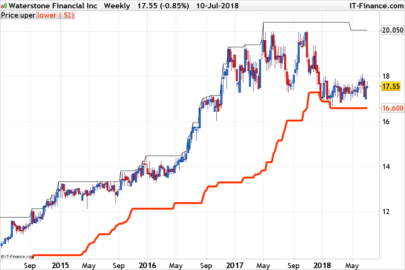
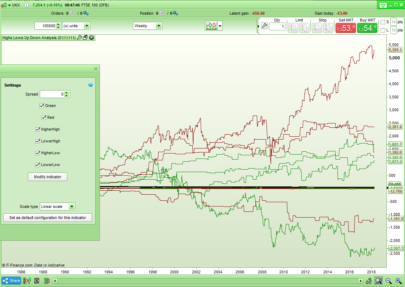
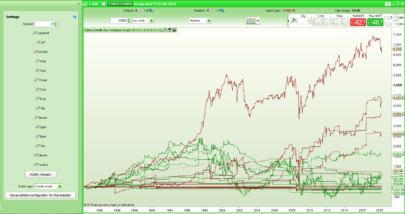
This indicator sets levels above and below the last closed candle and then calculates how many candles in the history managed to reach those levels. This is then displayed on the latest still forming candle as five lines below the previous low and five lines above the previous high with the percentage of candles that have reached this level in the past.
The results are calculated separately depending upon whether the previous candle was a red candle or a green candle.
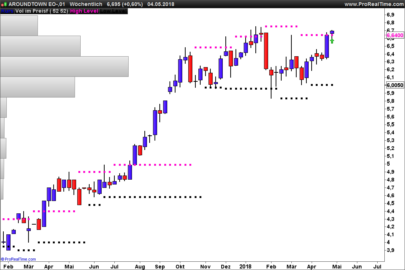
The spacing of the lines can be altered using the step variable. So you might want to see how many red candles reached 5 pips, 10 pips etc above and below the previous high and low. Alternatively the spacing (and historical calculations) can be based on a percentage of the closing price. If ‘Percentage’ is set to anything other than zero then percentage spaced lines are used otherwise if it is set to zero the spacing is based on the ‘Step’ value.
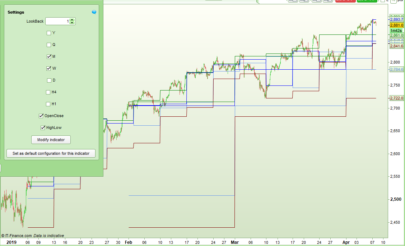
It is also possible to set the start date for calculating the history. If the date is set to zero then it analyses all of the candles on the chart.
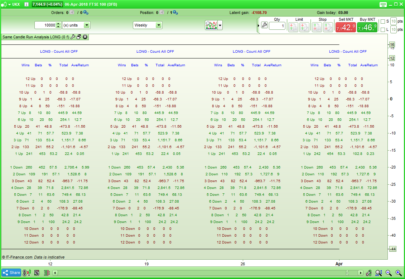
So for example if yesterday was a green candle we might see that history tells us that the high has been hit or passed 75% of the time after a green candle but the low only 33% of the time. We can then also see that the high plus 0.5% has been hit 50% of the time and the low minus 0.5% only 21% of the time and so on.
Hopefully this indicator can help with understanding the probability of a breakout or assist in setting stop loss levels based on where a price is most likely or least likely to go.
I advise downloading the ITF file and importing it to get full functionality.
|
1 2 3 4 5 6 7 8 9 10 11 12 13 14 15 16 17 18 19 20 21 22 23 24 25 26 27 28 29 30 31 32 33 34 35 36 37 38 39 40 41 42 43 44 45 46 47 48 49 50 51 52 53 54 55 56 57 58 59 60 61 62 63 64 65 66 67 68 69 70 71 72 73 74 75 76 77 78 79 80 81 82 83 84 85 86 87 88 89 90 91 92 93 94 95 96 97 98 99 100 101 102 103 104 105 106 107 108 109 110 111 112 113 114 115 116 117 118 119 120 121 122 123 124 125 126 127 128 129 130 131 132 133 134 135 136 137 138 139 140 141 142 143 144 145 146 147 148 149 150 151 152 153 154 155 156 157 158 159 160 161 162 163 164 165 166 167 168 169 170 171 172 173 174 175 176 177 178 179 180 181 182 183 184 185 186 187 188 189 190 191 192 193 194 195 196 197 198 199 200 201 202 203 204 205 206 207 208 209 210 211 212 213 214 215 216 217 218 219 220 221 222 223 |
//Red Green Breakout Probability //By Vonasi //20190802 defparam drawonlastbaronly = true //step = 3 //percentage = 0 if opendate > startdate or startdate = 0 then if percentage > 0 then step = close * (percentage/100) endif green = close[1] > open[1] red = close[1] < open[1] x = 0 hh = high > high[1] + x ll = low < low[1] - x if green then gtotal = gtotal + 1 endif if red then rtotal = rtotal + 1 endif if green and hh then g0hh = g0hh + 1 endif if red and hh then r0hh = r0hh + 1 endif if green and ll then g0ll = g0ll + 1 endif if red and ll then r0ll = r0ll + 1 endif g0hhperc = (g0hh/gtotal)*100 r0hhperc = (r0hh/rtotal)*100 g0llperc = (g0ll/gtotal)*100 r0llperc = (r0ll/rtotal)*100 x = x + step hh = high > high[1] + x ll = low < low[1] - x if green and hh then g1hh = g1hh + 1 endif if red and hh then r1hh = r1hh + 1 endif if green and ll then g1ll = g1ll + 1 endif if red and ll then r1ll = r1ll + 1 endif g1hhperc = (g1hh/gtotal)*100 r1hhperc = (r1hh/rtotal)*100 g1llperc = (g1ll/gtotal)*100 r1llperc = (r1ll/rtotal)*100 x = x + step hh = high > high[1] + x ll = low < low[1] - x if green and hh then g2hh = g2hh + 1 endif if red and hh then r2hh = r2hh + 1 endif if green and ll then g2ll = g2ll + 1 endif if red and ll then r2ll = r2ll + 1 endif g2hhperc = (g2hh/gtotal)*100 r2hhperc = (r2hh/rtotal)*100 g2llperc = (g2ll/gtotal)*100 r2llperc = (r2ll/rtotal)*100 x = x + step hh = high > high[1] + x ll = low < low[1] - x if green and hh then g3hh = g3hh + 1 endif if red and hh then r3hh = r3hh + 1 endif if green and ll then g3ll = g3ll + 1 endif if red and ll then r3ll = r3ll + 1 endif g3hhperc = (g3hh/gtotal)*100 r3hhperc = (r3hh/rtotal)*100 g3llperc = (g3ll/gtotal)*100 r3llperc = (r3ll/rtotal)*100 x = x + step hh = high > high[1] + x ll = low < low[1] - x if green and hh then g4hh = g4hh + 1 endif if red and hh then r4hh = r4hh + 1 endif if green and ll then g4ll = g4ll + 1 endif if red and ll then r4ll = r4ll + 1 endif g4hhperc = (g4hh/gtotal)*100 r4hhperc = (r4hh/rtotal)*100 g4llperc = (g4ll/gtotal)*100 r4llperc = (r4ll/rtotal)*100 g0hhperc = round(g0hhperc) r0hhperc = round(r0hhperc) g0llperc = round(g0llperc) r0llperc = round(r0llperc) g1hhperc = round(g1hhperc) r1hhperc = round(r1hhperc) g1llperc = round(g1llperc) r1llperc = round(r1llperc) g2hhperc = round(g2hhperc) r2hhperc = round(r2hhperc) g2llperc = round(g2llperc) r2llperc = round(r2llperc) g3hhperc = round(g3hhperc) r3hhperc = round(r3hhperc) g3llperc = round(g3llperc) r3llperc = round(r3llperc) g4hhperc = round(g4hhperc) r4hhperc = round(r4hhperc) g4llperc = round(g4llperc) r4llperc = round(r4llperc) drawsegment(barindex[1],high[1],barindex,high[1]) coloured(0,128,0) drawsegment(barindex[1],high[1]+step,barindex,high[1]+step) coloured(0,128,0) drawsegment(barindex[1],high[1]+(step*2),barindex,high[1]+(step*2)) coloured(0,128,0) drawsegment(barindex[1],high[1]+(step*3),barindex,high[1]+(step*3)) coloured(0,128,0) drawsegment(barindex[1],high[1]+(step*4),barindex,high[1]+(step*4)) coloured(0,128,0) drawsegment(barindex[1],low[1],barindex,low[1]) coloured(128,0,0) drawsegment(barindex[1],low[1]-step,barindex,low[1]-step) coloured(128,0,0) drawsegment(barindex[1],low[1]-(step*2),barindex,low[1]-(step*2)) coloured(128,0,0) drawsegment(barindex[1],low[1]-(step*3),barindex,low[1]-(step*3)) coloured(128,0,0) drawsegment(barindex[1],low[1]-(step*4),barindex,low[1]-(step*4)) coloured(128,0,0) if green then drawtext(" #g0hhperc#% ",barindex-1,high[1],SansSerif,standard,10)coloured(0,128,0) drawtext(" #g1hhperc#% ",barindex-1,high[1]+step,SansSerif,standard,10)coloured(0,128,0) drawtext(" #g2hhperc#% ",barindex-1,high[1]+(step*2),SansSerif,standard,10)coloured(0,128,0) drawtext(" #g3hhperc#% ",barindex-1,high[1]+(step*3),SansSerif,standard,10)coloured(0,128,0) drawtext(" #g4hhperc#% ",barindex-1,high[1]+(step*4),SansSerif,standard,10)coloured(0,128,0) drawtext(" #g0llperc#% ",barindex-1,low[1],SansSerif,standard,10)coloured(128,0,0) drawtext(" #g1llperc#% ",barindex-1,low[1]-step,SansSerif,standard,10)coloured(128,0,0) drawtext(" #g2llperc#% ",barindex-1,low[1]-(step*2),SansSerif,standard,10)coloured(128,0,0) drawtext(" #g3llperc#% ",barindex-1,low[1]-(step*3),SansSerif,standard,10)coloured(128,0,0) drawtext(" #g4llperc#% ",barindex-1,low[1]-(step*4),SansSerif,standard,10)coloured(128,0,0) endif if red then drawtext(" #r0hhperc#% ",barindex-1,high[1],SansSerif,standard,10)coloured(0,128,0) drawtext(" #r1hhperc#% ",barindex-1,high[1]+step,SansSerif,standard,10)coloured(0,128,0) drawtext(" #r2hhperc#% ",barindex-1,high[1]+(step*2),SansSerif,standard,10)coloured(0,128,0) drawtext(" #r3hhperc#% ",barindex-1,high[1]+(step*3),SansSerif,standard,10)coloured(0,128,0) drawtext(" #r4hhperc#% ",barindex-1,high[1]+(step*4),SansSerif,standard,10)coloured(0,128,0) drawtext(" #r0llperc#% ",barindex-1,low[1],SansSerif,standard,10)coloured(128,0,0) drawtext(" #r1llperc#% ",barindex-1,low[1]-step,SansSerif,standard,10)coloured(128,0,0) drawtext(" #r2llperc#% ",barindex-1,low[1]-(step*2),SansSerif,standard,10)coloured(128,0,0) drawtext(" #r3llperc#% ",barindex-1,low[1]-(step*3),SansSerif,standard,10)coloured(128,0,0) drawtext(" #r4llperc#% ",barindex-1,low[1]-(step*4),SansSerif,standard,10)coloured(128,0,0) endif endif return |
Share this
No information on this site is investment advice or a solicitation to buy or sell any financial instrument. Past performance is not indicative of future results. Trading may expose you to risk of loss greater than your deposits and is only suitable for experienced investors who have sufficient financial means to bear such risk.
ProRealTime ITF files and other attachments :
Find other exclusive trading pro-tools on ![]()
PRC is also on YouTube, subscribe to our channel for exclusive content and tutorials


A nice enhancement for this would be if you could calculate the probability of the monthly close graphed on a weekly TF (or Weekly close graphed on a Daily TF) but update the probability after each bar close based on the level of the close respective to the previous Months close (Weekly TF) or Weeks Close (Daily TF). This means that statistically speaking the accuracy of the probability should increase as the Week (Daily TF) or Month (Weekly TF) progresses.
Good job! 🙂
juanj – yes there are plenty of possibilities and if I can find some time then I will work on them but I’m very busy with other stuff right now!
Thanks for the compliments Maxime Baudin.
Muy interesante ¡¡¡… gracias X el aporte.
Thank you for your nice indicator
Hi Vonasi, thanks for this great idea. Obviously the indicator works for everyone commenting here but when I added it to my library and added it to a €/$ chart it just leaves a blank space? Have PRT changed the import? Normally it searches my Downloads folder but this time I had to drag and drop the itf file? Tried different perameters and left the start date as 0. Also tried 20200101 as well. I have 1000 units on the chart.
Any ideas? Cheers!
You are applying it to the price chart? As far as I am aware nothing has changed with the import procedure. Dragging and dropping does not sound right to me. I will test.
I just imported and applied the indicator with no issues at all. Must be operator error at your end or something to do with that weird computer you use! 🙂
Yeah it’s weird, never seen the drag and drop before? https://www.dropbox.com/s/y1n9hlhsfyn7gk0/PRTdraganddrop.png?dl=0
Applied it to the Price chart and all good now thanks.
God damn Macbooks! Already, after only two years, had to replace all the USB-C sockets this week…
I can see it on the chart in your image! Zoom in on the last candle.
This is really a fascinating indicator Vonasi! Particularly when it gives probabilities that are sometimes contrary to how the previous history of candles appears. I was wondering is there an easy way of adding a formula to the code that would show standard deviations as well as steps (ticks, pips) and percentages? Great work.
How would you automate it with the simplified creation tool if you wanted to go long only if the Red/Green Prob is over 80% and ditto for shorts?
I am a bit late finding this interesting tool, but have found it useful already.
Please can anyone tell me how to increase the font size for the displayed data, probably to at least twice its present size as it is quite small on my screens. Thank you
In the all the DRAWTEXT lines of code change the 10 to a larger number.
Vonasi. Thank you for a very prompt response.
Following on from your earlier advice, I changed the ‘drawtext’ command to various sizes before settling with 20, instead of 10 (default) and it it now easily read.
I am running the utility on 3 FTSE charts: Volume (1000), 2H and Daily, so next week should be very interesting after the turmoil of the coronavirus panic.
Hello Vonasi, thank you for your work. Is it possible to draw this lines on past candles other than the [1] ? I would like to analyse each time this appears :
c1 = open > high[1] and close[1] > open [1]
Thank you for your help
Cheers
If you are on v11 then you can change the DRAWSEGMENT instructions to DRAWRAY. You will need to modify the second BARINDEX value to BARINDEX+n where n is how far into the future you want to draw the lines.
Ça ne fonctionne sur aucune valeur, je dois être trop con…
il faut appliquer l’indicateur sur le prix.
Je crains de ne pas comprendre… Cela indique la probabilité de la prochaine bougie ou donne la probabilité de la bougie actuelle ? (je n’ai pas les cours en direct sur prorealtime est ce que cela marche différemment ?)
Did it show the probability of the next candle or the probability of the current (last fully formed)candle ?