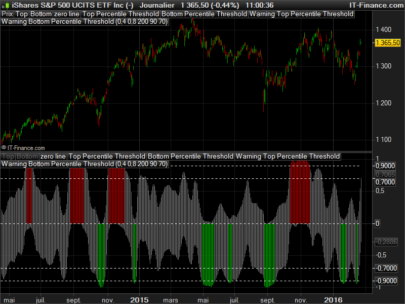
The Twiggs Money Flow indicator was posted earlier but I thought to add my variation to the library as well, since the normalization process might add value.
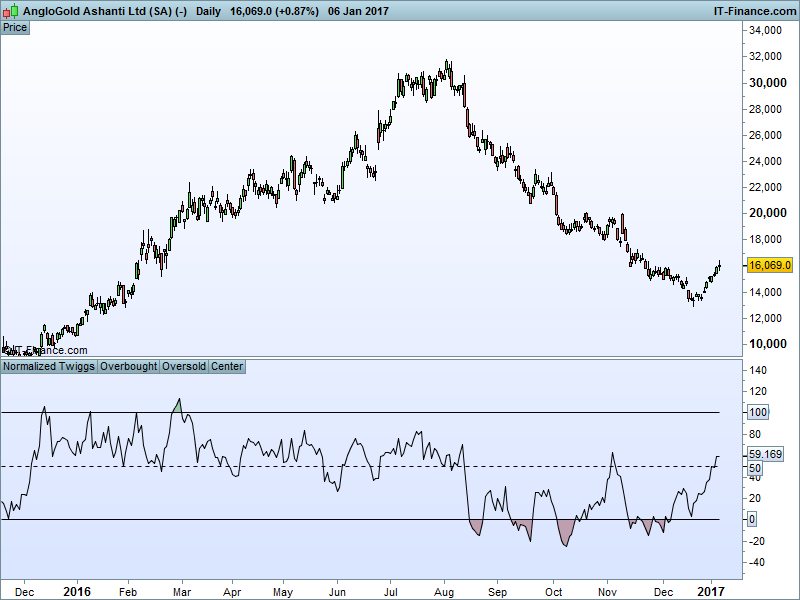
The normalization process I use is what John Bollinger describes in his book – take the average of the indicator, create two bands based on the standard deviation and express the indicator as to where it is inside the bands. The question the normalization answers is “where inside the frequency distribution is my indicator value?” You can change the parameters and the overbought/oversold criteria. Above 100 would mean that your Twiggs Money Flow is above 2 standard deviations of the average and below 0 would mean that your Twiggs Money Flow is below 2 standard deviations of the average. The center line is the average. I find that it trades divergence well. Below is my code:
|
1 2 3 4 5 6 7 8 9 10 11 12 13 14 15 16 17 18 19 20 21 22 23 24 25 26 27 28 |
//Calculate Twiggs Money Flow TRL = min(low, close[1]) TRH = max(high, close[1]) BuySellPressure = ((close - TRL) - (TRH - close)) TrueRange = (TRH - TRL) MF = (BuySellPressure / TrueRange) * volume //Express volume as fraction of total volume TotalMF = exponentialaverage[20](MF) TotalVolume = exponentialaverage[20](Volume) FinalMF = TotalMF / TotalVolume //Normalize Twiggs Money Flow //Generic normalization process Indicator = FinalMF AverageIndicator = average[200](Indicator) StandardDeviation = STD[200](Indicator) UpperBand = AverageIndicator + (2 * StandardDeviation) LowerBand = AverageIndicator - (2 * StandardDeviation) NormalizedIndicator = ((Indicator - LowerBand) / (UpperBand - LowerBand)) * 100 Overbought = 100 Center = 50 Oversold = 0 Return NormalizedIndicator as "Normalized Twiggs", Overbought as "Overbought", Oversold as "Oversold", Center as "Center" |
Share this
No information on this site is investment advice or a solicitation to buy or sell any financial instrument. Past performance is not indicative of future results. Trading may expose you to risk of loss greater than your deposits and is only suitable for experienced investors who have sufficient financial means to bear such risk.
ProRealTime ITF files and other attachments :
Find other exclusive trading pro-tools on ![]()
PRC is also on YouTube, subscribe to our channel for exclusive content and tutorials