

Stochastic Equilibrium
February 5, 2016, 10:51 PM
Indicators
5 Comments
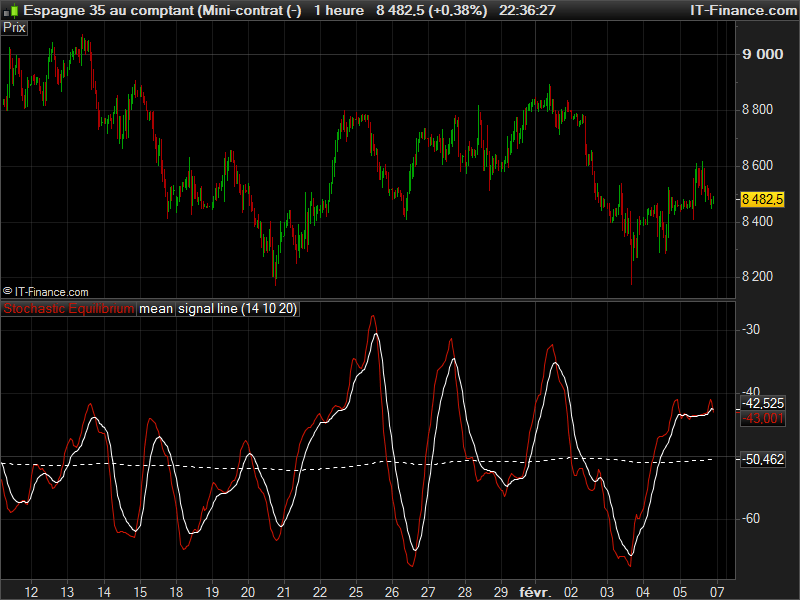
Stochastic is an indicator that try to draw the mean price over short and long period while making attempt to identify potential revert in the so called overbought and oversold level.
In this indicator, the price is replace with its mean calculated by the division of the highest and lowest price over N periods. It makes the stochastic less noisy but also more laggy.
It could be used to find good entries and re-entries on a clear identified trend.
Of course, because stochastic is built to find reversals points, this indicator will find its powerness in flat range.
period = 50
N = 10
K = 20

if barindex>period then
 ll = lowest[period](low)
 hh = highest[period](high)
 mid = (ll+hh)/2

 sto = SmoothedStochastic[N,K](mid)
 avg = exponentialaverage[1000](sto)
 sig = exponentialaverage[N](sto)
endif

RETURN -sto coloured(200,20,3), -avg as "mean", -sig as "signal line"
Download
Filename:
Stochastic-Equilibrium.itf
Downloads:
126
Legend
I created ProRealCode because I believe in the power of shared knowledge. I spend my time coding new tools and helping members solve complex problems.
If you are stuck on a code or need a fresh perspective on a strategy, I am always willing to help. Welcome to the community!
Author’s Profile
Loading...