







Haos Visual
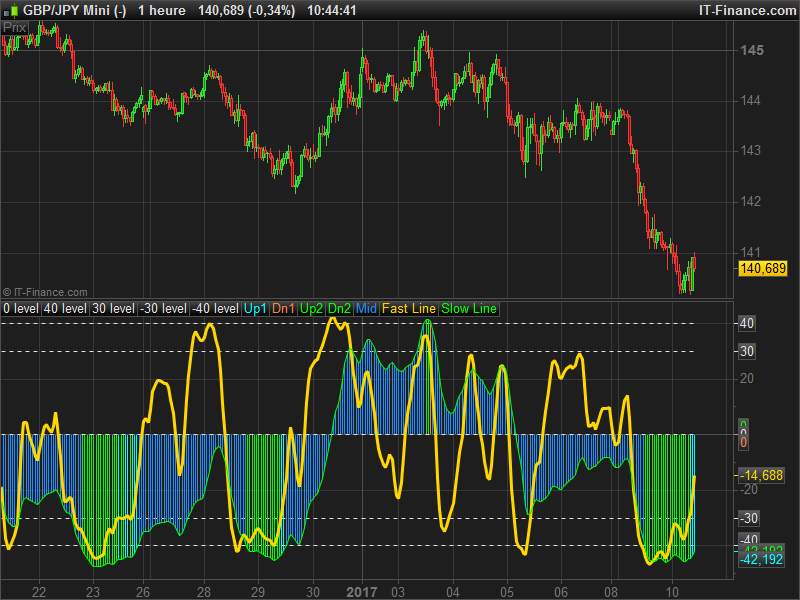
The Haos Visual technical indicator is a trend indicator in the form of a histogram oscillating around the zero level.
The algorithm of the Haos Visual indicator measures the difference between two William’s Percent Rank T3 oscillators with different periods.
A signal line is also calculated.
The Haos Visual stock market indicator identifies over-bought and over-sold markets and could be used to find potential price reversal key zones.
Indicator converted from MT4 by request on English forum.
//PRC_HaosVisual | indicator
//10.01.2017
//Nicolas @ www.prorealcode.com
//Sharing ProRealTime knowledge
//Converted from MT4 version

// --- parameters
// *** WPR1 ***
t3period   = 8
b          = 0.7
per        = 14
psel       = 30
pbuy       = -30
// *** WPR2 ***
t3period2  = 8
b2         = 0.7
per2       = 96
psel2      = 40
pbuy2      = -40
// ---

once b2=b*b
once b3=b2*b
once c1=-b3
once c2=(3*(b2+b3))
once c3=-3*(2*b2+b+b3)
once c4=(1+3*b+b3+3*b2)
once n=t3period
once qb2=b2*b2
once qb3=qb2*b2
once qc1=-qb3
once qc2=(3*(qb2+qb3))
once qc3=-3*(2*qb2+b2+qb3)
once qc4=(1+3*b2+qb3+3*qb2)
once qn=t3period2
if(n<1) then
 n=1
endif
once n=1+0.5*(n-1)
once w1=2/(n+1)
once w2=1-w1
if(qn<1) then
 qn=1
endif
once qn=1+0.5*(qn-1)
once qw1=2/(qn+1)
once qw2=1-qw1
//---------

if barindex>per2 then
 wpr=Williams[per](close)
 qwpr=Williams[per2](close)

 e1=w1*wpr+w2*e1
 e2=w1*e1+w2*e2
 e3=w1*e2+w2*e3
 e4=w1*e3+w2*e4
 e5=w1*e4+w2*e5
 e6=w1*e5+w2*e6
 t3=c1*e6+c2*e5+c3*e4+c4*e3+50
 Buffer1=t3

 qe1=qw1*qwpr+qw2*qe1
 qe2=qw1*qe1+qw2*qe2
 qe3=qw1*qe2+qw2*qe3
 qe4=qw1*qe3+qw2*qe4
 qe5=qw1*qe4+qw2*qe5
 qe6=qw1*qe5+qw2*qe6
 qt3=qc1*qe6+qc2*qe5+qc3*qe4+qc4*qe3+50
 Buffer2=qt3

 if (t3>psel and qt3>psel2) then
  Dn2 =qt3
  Up2 =0
  Dn1 =0
  Up1 =0
  Mid =0
 elsif (t3<=psel and qt3>psel2) then
  Dn1 =qt3
  Up2 =0
  Dn2 =0
  Up1 =0
  Mid =0
 elsif (t3<pbuy and qt3<pbuy2) then
  Up2 =qt3
  Dn2 =0
  Dn1 =0
  Up1 =0
  Mid =0
 elsif (t3>=pbuy and qt3<pbuy2) then
  Up1 =qt3
  Up2 =0
  Dn1 =0
  Dn2 =0
  Mid =0
 else
  Mid =qt3
  Up2 =0
  Dn1 =0
  Up1 =0
  Dn2 =0
 endif
endif

//return all levels to dotted lines, all others variables to histogram except the last 2 ones to lines

RETURN 0 as "0 level", psel2 as "40 level", psel as "30 level", pbuy as "-30 level", pbuy2 as "-40 level", Up1 coloured(0,255,255) as "Up1", Dn1 coloured(255,127,80) as "Dn1", Up2 coloured(0,255,0) as "Up2", Dn2 coloured(0,255,0) as "Dn2", Mid coloured(30,144,255) as "Mid", Buffer1 coloured(255,215,0) as "Fast Line", Buffer2 coloured(0,255,0) as "Slow Line"


Comments
You must be logged in to post a comment.


The request to code this indicator came from this topic: https://www.prorealcode.com/topic/haos-visual-indicator-request-for-nic/
I haven't read anything myself about this indicator, but like many other oscillators, you might find it useful to catch potential reversal zones (reversion to the mean). So use it with TMA bands is somehow a good idea.


Lyny / Nicolas
Please advise whether you proceded with the code in ProOrder and if so where can I find it