VSA deviation curve

VSA deviation curve

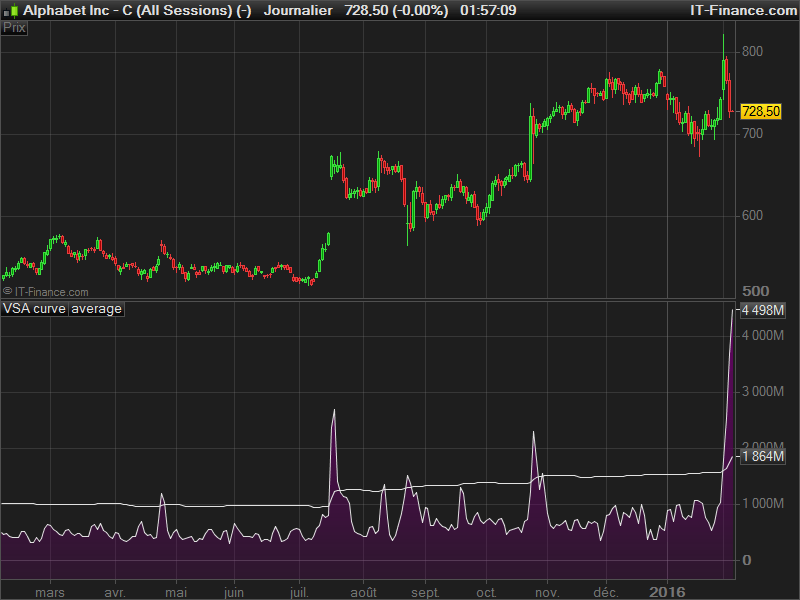
This indicator draw the difference between the high and low of the price related to the volume. Then we make an average of this oscillator over x period (200 periods by default) plus its standard deviation factorized (factor = 1.5 by default). This line act as a signal for abnormal volume exchange over the specified instrument.

This formula is a derivate from the volume spread analysis candles formations.


Share this

Risk disclosure:

No information on this site is investment advice or a solicitation to buy or sell any financial instrument. Past performance is not indicative of future results. Trading may expose you to risk of loss greater than your deposits and is only suitable for experienced investors who have sufficient financial means to bear such risk.

ProRealTime ITF files and other attachments : How to import ITF files into ProRealTime platform?

PRC is also on YouTube, subscribe to our channel for exclusive content and tutorials

avatar
Register or

Likes

avatar avatar avatar avatar
Related users ' posts
kal Buenos días TACBOLSA. Estoy muy interesado en ver tu blog para ver la explicación con detall...
1Randy I would be interested an invite to your blog. I am still learning about the VSA and it looks...
repropel Buenos días TACBOLSA. Yo también estoy interesado en visitar tu blog. Podrías enviarme una i...
Bard "Bacon with speed" is a new one on me, Apologies, the link was not working on my iphone ...
TAC Bolsa I already published it ... in prorealcode ... Next time ... request a change of programmi...
TAC Bolsa I already published it … in prorealcode … https://www.prorealcode.com/prorealtime-indicator...
lglmrc Can't make it work, says: "Define p variable"
Ezio Hi Xel and thanks, do you know if there is a way in PRC of reading/counting intraday ticks?...
inadis ive just discovered this, i must say very nice thanks.

Top