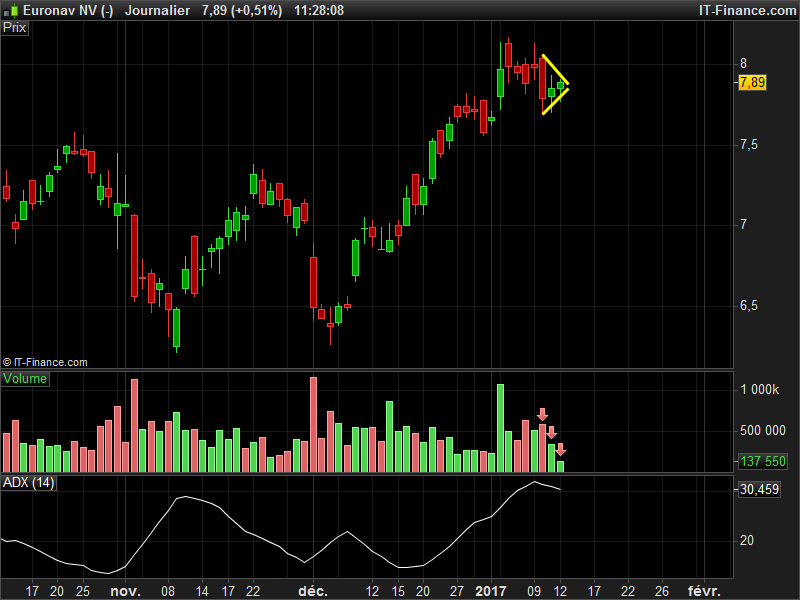
Boomer pattern

Boomer pattern

The boomer pattern is a special graphic configuration formed by three bars in sequence, of which the last two are inside the previous one. In practice the first bar encloses the two successive which have minimum and maximum respectively upper and lower than the previous.

Ultimately, after the first bar, the pattern contain two “inside days”, days when the minimum and the maximum grow without exceeding the values of the previous range.

That graphic situation indicates a progressive compression of volatility which normally gives rise to an explosion of significant quantities prices.

This pattern identify a price squeeze consisting of three bars in the sequence having the characteristics described above which is a prelude to a subsequent volatility of explosion. However this pattern of course not allow in any way to predict the direction of the breakout, if not relying on continuation pattern or reversal of technical analysis, such as the triangles that are formed on a maximum or a minimum period of rather than in the middle of a trend in place.

The pattern, results in a triangular shape which can be of a reversal or continuation of the main trend.

In this ProScreener code, an ADX filter is added to know if the instrument is trending (ADX value must be above 25 at least). 

I also add a DI+ and DI- comparison (above / below), to find what is the actual trend and give an information of what would be the direction of the triangle breakout : bullish or bearish. This is the sorted column criteria: 1 = potential bullish explosion to come, -1=bearish one).


Share this

Risk disclosure:

No information on this site is investment advice or a solicitation to buy or sell any financial instrument. Past performance is not indicative of future results. Trading may expose you to risk of loss greater than your deposits and is only suitable for experienced investors who have sufficient financial means to bear such risk.

ProRealTime ITF files and other attachments : How to import ITF files into ProRealTime platform?

PRC is also on YouTube, subscribe to our channel for exclusive content and tutorials

  1. gianlox • 01/12/2017 #

    I created the indicator
    //Boomer pattern indicator

    c = summation[2](high<high[1] and low>low[1])=2
    v = summation[2](volume<volume[1])=2
    a = adx[14]>=25
    d = DIplus[14]>DIminus[14]
    e = DIplus[14]<DIminus[14]
    boomerlong = c and v and a and d
    boomershort = c and v and a and e

    //bullish trend
    if boomerlong then
    DRAWARROWUP(barindex, low- low*0.003) coloured(0,255,0)
    DRAWcandle(open, high, low, close) coloured(0,255,2)
    DRAWTEXT(\"Boomer Long\", barindex, high+high*0.03) coloured(255,255,2)
    endif

    //bearish trend
    if boomershort then
    DRAWARROWdown(barindex, high+ high*0.003) coloured(255,0,0)
    DRAWcandle(open, high, low, close) coloured(255,0,0)
    DRAWTEXT(\"Boomer Short\", barindex, low-low*0.03) coloured(255,255,2)
    endif

    return boomerlong or boomershort


    • Nicolas • 01/12/2017 #

      Thanks for sharing it here! 😉

  2. johan_s • 01/12/2017 #

    Hi
    Can’t get the indicator to work. “Syntax error line 13 character 12”
    Can somebody help me?

    • Nicolas • 01/12/2017 #

      Not an indicator but a screener.

    • johan_s • 01/12/2017 #

      Nicolas! You screener works perfekt, thank you. But theI meant the indicator and the code gianlox posted. 

    • Nicolas • 01/12/2017 #

      Oh sorry! I think you are still using the 10.2 version of the platform that don’t allow these new graphical instructions, that’s the reason why you get this syntax error.

  3. Chamberskob • 01/12/2017 #

    Hi Nicolas, your screeners are great thanks heaps! I am just getting used to PRT. Any chance you have some for: Cup and Handle Pattern, High tight flag and (VCP) volatility contraction patterns…..??

    • Nicolas • 01/12/2017 #

      Why not, please add a query as a new topic in the screeners forum.

avatar
Register or

Likes

avatar avatar avatar avatar avatar avatar avatar avatar avatar avatar avatar
Related users ' posts
Stephane0174 Bonjour et merci pour le Screener. Je suis nouveau ici et je ne connais rien en programmati...
Nicolas Je pense que c'est le copier/coller des guillemets qui pose problème, il faudrait les retape...
enriquem
3 years ago
bab el franco hello once installed I have no results despite different options of markets or temporality
Vinks_o_7
3 years ago
3 Bars LONG
3 Bars LONG
3
Screeners
Maxime Csls Hello Vinks_o_7 Thank You for your work. I am working on a different candle setup. Your wor...
Vinks_o_7 Hi Maxime This is a momentum strategy that I use for swing trading (couple of day, weeks). ...
haimpinto Thank you for the code How can I use it for a short trend?
Sofitech le screener "resserrement" (le premier) correspond aux flèches rouge / vertes sur l'image ?
JC_Bywan Bonjour, non les flèches sur l'image correspondent aux croisements des ema15/ema60, 2e screener
jc_aries Thanks for the SCREENER. I have a doubt. Is it not necessary to put a time interval for the ...
BoutDePain Here is the updated screener with variables that are more understandable:
BoutDePain https://www.prorealcode.com/topic/three-line-breakouts/#post-155918
haimpinto Hi What should be added in the code in order to limit the price range of the shares it disp...
StephFor //ind1 = ZigZagPoint[2*averagetruerange[200]](close) avr = 3 //3% ind1 = ZigZag[avr](close...
Manu L. @Steph un grand merci pour ton aide mais :-( J'ai copier le code tel quel mais cependant j...
AlphaMauss Je n'ai pas réussi à faire fonctionner l'indicateur avec le code fourni en commentaire sur P...
Fozzie Très bon code, merci pour le travail.
Titi Gone Très bon travail merci
Mike.44 Hello Merci beaucoup pour le code !
smarttrader1 hi, can you improve on this ? can you make this flag screeener for day trading, I want to be...
Nicolas Please open a new topic in the proscreener forum for this specific query. Please provide exp...
NHGambler Nice screener. Only thing is I wonder if this is aimed more at small/medium/large caps? I ...
jonny.cash the chikou is 26 periods behind current price, it's not the close
Nicolas Chikou is the current Close decayed 26 periods in the past of the chart.
jonny.cash yes, thanks for the correction. my post was complete rubbish
mickey992 salut merci pour ton partage et ton travaille
patapouf Hi Vivien René I just discovered your “Ordered trend-following stocks Screener”. Great work...
yeoreum Thank you very much for the screener, it reminds me on Minervini VCP. How to change th...
reecet any codes like this but in minutes and hours rather than days?
PHAN100 bonjour, je viens de tester ce screener, je constate une anomalie...il ne renvoie pas l'e...
bibifricotin Je pense avoir compris dans la première colonne exemple 92 le 9 indique la période et le 2 ...
Leo_da_Pisa It seems to work very well. Good for confirmation. Thanks for sharing Vivien.
jaginho Bonjour Vivien, je n'arrive pas à comprendre ce screener... En tout cas merci pour tes contr...
avatar
Anonymous Superb, merci!
Oxxoz Re bonjour Vivien, Il me smeble que 3 mois, c'est 60 séances. Cordialement,
Vinks_o_7 thanks ...and It can be used on a monthly and weekly basis by changing just the duration in ...

Top