







Value Chart High/Low
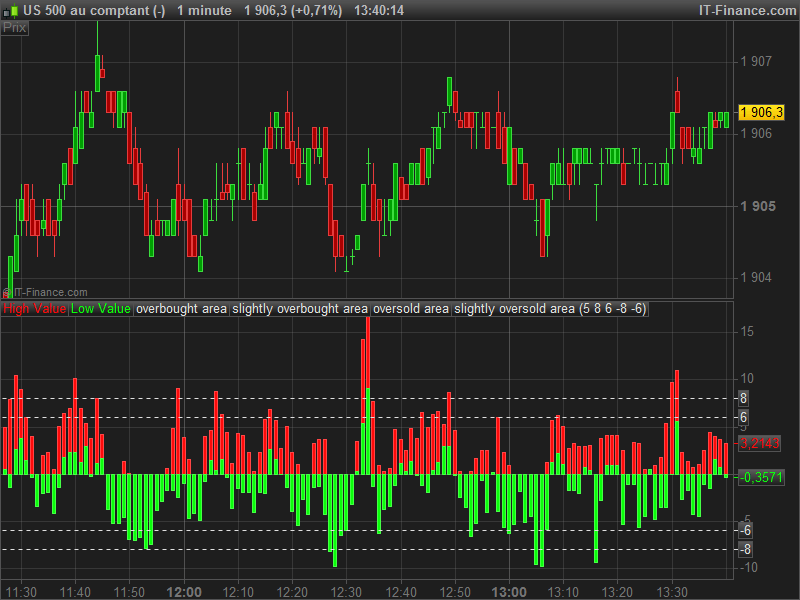
The original value chart is made of OHLC candlesticks drowned on a normalized scale. This one only reflect high and low values, that are more useful for its purpose.
This indicator is popular in scalping trading and short-term binary options because of its effectiveness to spot prices excess on a relative short time scale. Period and overbought/oversold areas are configurable to fit your timeframe and trading method.
//parameters :
//ExtDepth = 5
//Overbought = 8
//SlightlyOverbought = 6
//Oversold = -8
//SlightlyOversold = -6

sumHigh = summation[ExtDepth](high)
sumLow = summation[ExtDepth](low)

floatingaxis = 0.1 * (sumHigh+sumLow)
volatilityunit = 0.04 * (sumHigh-sumLow)

vcHigh = (high-floatingaxis) / volatilityunit
vcLow = (low-floatingaxis) / volatilityunit

RETURN  vcHigh coloured(255,10,10) as "High Value", vcLow coloured(10,255,10) as "Low Value", Overbought as "overbought area", SlightlyOverbought as "slightly overbought area", Oversold as "oversold area", SlightlyOversold as "slightly oversold area"
Comments
You must be logged in to post a comment.



For your interest i have coded the ProRealTime next generation version of this indicator, with all the OHLC value. I'm talking about it here in the forum : http://www.prorealcode.com/topic/the-next-prorealtime-version-10-3-and-new-graphical-functionnalities/#post-3316
Very nice, thanks for your contribution. Next generation of the platform will have the ability to draw custom candlestick with only a simple instruction, then we'll can make this indicator entirely without restriction. You can have a look on the new DRAWCANDLESTICK instruction here : http://www.prorealcode.com/documentation/drawcandle/
Drawing Bar chart will be also possible with the instruction DRAWBARCHART : http://www.prorealcode.com/documentation/drawbarchart/
Don't really know it. I only have a VIP Beta access and it looks promising. A lot of improvements have been made for indicators development and beyond. Of course i'll give news here in ProRealCode as soon as possible.
I already have investigated in new drawing capabilities and it is awesome! At least, we can do almost anything for chart drawing. Our imagination the limit :)
This was my first thought, but 1 minute bars don't look like these on my charts. Hmm...