







CM_Laguerre PPO PercentileRank Mkt Tops & Bottoms
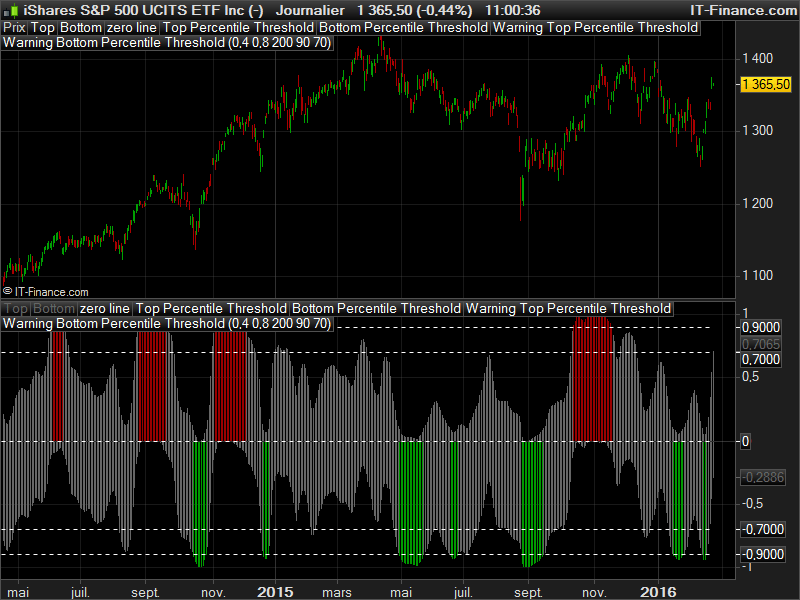
This indicator find market tops and bottoms with the use of the percentile rank of a derivated Laguerre oscillator. The market tops and bottoms are spotted with unique colors (green for bottoms and red for tops), when the oscillator cross over the extreme percentile rank (90%). The mid threshold lines could also act as warning that the price has reached a top or a bottom.
Fits well on a daily basis as ranking an oscillator value by its percentile rank is a good idea that can be explore in many other ways. Here is another path to follow for future research!
// parameters :
// Short = 0.4
// Long = 0.8
// lkb = 200 (Look back period)
// pctile = 90 (Extreme threshold lines)
// midpctile = 70 (Warning threshold lines)

if(barindex>lkb) then

  hl2 = (high+low)/2

  //laguerre short
  Ls0 = (1 - Short)*hl2+Short*(Ls0[1])
  Ls1 = -Short*Ls0+(Ls0[1])+Short*(Ls1[1])
  Ls2 = -Short*Ls1+(Ls1[1])+Short*(Ls2[1])
  Ls3 = -Short*Ls2+(Ls2[1])+Short*(Ls3[1])
  lmas = (Ls0 + 2*Ls1 + 2*Ls2 + Ls3)/6

  //laguerre long
  Ll0 = (1 - Long)*hl2+Long*(Ll0[1])
  Ll1 = -Long*Ll0+(Ll0[1])+Long*(Ll1[1])
  Ll2 = -Long*Ll1+(Ll1[1])+Long*(Ll2[1])
  Ll3 = -Long*Ll2+(Ll2[1])+Long*(Ll3[1])
  lmal = (Ll0 + 2*Ll1 + 2*Ll2 + Ll3)/6

  pctileB = pctile * -1

  //PPO Plot
  ppoT = (lmas-lmal)/lmal*100
  ppoB = (lmal-lmas)/lmal*100

  //PercentRank of PPO
  // percent rank = nb of value less than our value / (nb of values less than our value + nb of values greater than our value)
  topvalueMinus = 0
  topvaluePlus = 0
  bottomvalueMinus = 0
  bottomvaluePlus = 0

  for i = 0 to lkb do
   if ppoT[i]<ppoT then
    topvalueMinus = topvalueMinus+1
   else
    topvaluePlus = topvaluePlus+1
   endif
   if ppoB[i]<ppoB then
    bottomvalueMinus = bottomvalueMinus+1
   else
    bottomvaluePlus = bottomvaluePlus+1
   endif
  next

  pctRankT = topvalueMinus / (topvalueMinus+topvaluePlus)
  pctRankB = (bottomvalueMinus / (bottomvalueMinus+bottomvaluePlus)) *-1

  //coloring histogram
  if pctRankT>=pctile/100 then
   TopColor = 1
  else
   TopColor = -1
  endif

  if pctRankB>=pctileB/100 then
   BottomColor = 1
  else
   BottomColor = -1
  endif
endif

RETURN pctRankT coloured by TopColor as "Top", pctRankB coloured by BottomColor as "Bottom", 0 as "zero line", pctile/100 as "Top Percentile Threshold", pctileB/100 as "Bottom Percentile Threshold",  midpctile/100 as "Warning Top Percentile Threshold", (midpctile*-1)/100 as "Warning Bottom Percentile Threshold"
This code is adapted from pinescript one by Chris Moody.
Comments
You must be logged in to post a comment.

Then I have tried this but nor does it run : //coloring histogram if pctRankT>=pctile/100 then r=255 g=0 b=0 else r=204 g=204 b=204 endif if pctRankB>=pctileB/100 then r=255 g=0 b=255 else r=204 g=204 b=204 endif endif RETURN pctRankT coloured (r,g,b) as "Top", pctRankB coloured (r,g,b) as "Bottom", 0 as "zero line", pctile/100 as "Top Percentile Threshold", pctileB/100 as "Bottom Percentile Threshold", midpctile/100 as "Warning Top Percentile Threshold", (midpctile*-1)/100 as "Warning Bottom Percentile Threshold"
Hello everyone, I don't understand the color setting. The indicator settings combo only allows you to have all the red or green bars or the part above the extreme percentile rank. I tried to modify directly in the code the part as below but it does not run : //coloring histogram if pctRankT>=pctile/100 then TopColor =(255,0,0) else TopColor =(204,204,204) endif if pctRankB>=pctileB/100 then BottomColor = (255,0,255) else BottomColor = (204,204,204) endif endif



Dear Nicolas,
I've been trying this indicator but unfortunately i can not get the settings right. I do not see the colors red and green like in your example. I've been trying several settings also with additional
colorzones but unfortunatley with no luck. Ive tried it on the 10.2 version from IG and on the 10.3 from PRT. I hope you can explain me what i'm doing wrong.
Thank you on forehand for your time.
Best regards,
Patrick
I
Here we are ! //coloring histogram if pctRankT>=pctile/100 then r=255 g=0 b=0 else r=204 g=204 b=204 endif if pctRankB<=pctileB/100 then rr=0 gg=255 bb=0 else rr=204 gg=204 bb=204 endif endif RETURN pctRankT coloured (r,g,b) as "Top", pctRankB coloured (rr,gg,bb) as "Bottom", 0 as "zero line", pctile/100 as "Top Percentile Threshold", pctileB/100 as "Bottom Percentile Threshold", midpctile/100 as "Warning Top Percentile Threshold", (midpctile*-1)/100 as "Warning Bottom Percentile Threshold"